

Bitcoin’s rise on June 1 saw a big jump in the Altcoins too. Ethereum, Ripple, Litecoin all turned green. However, the decline was even quicker. Some of the Altcoins, such as ETHUSD and BCH, recovered from the drop and are displaying Bullish signs.
Ripple, on the other hand, seems to have totally lost its earlier momentum. It dropped for four consecutive days. From June 2 till yesterday, XRPUSD decreased by almost 25%.
BCHUSD price analysis and prediction
The day’s range for Bitcoin Cash is $253.72 — $259.02 and is currently trading at $257. It is above trading above 1.13% over its previous close.
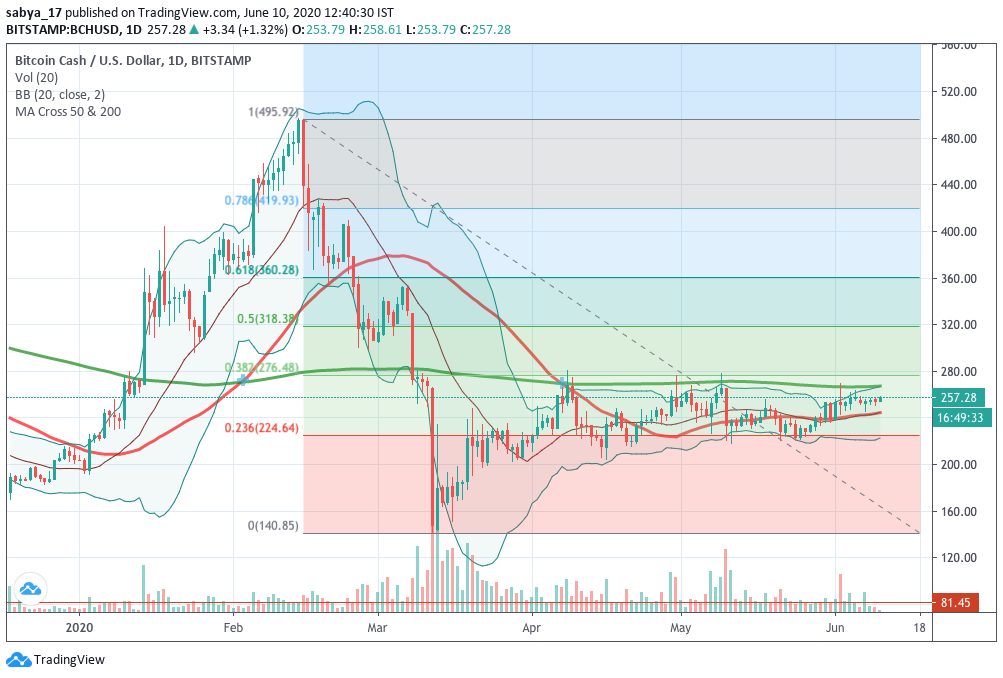
Source: TradingView.com
The daily timeframe for BCHUSD shows that recently the traded volume is above the average traded volume. The daily candlesticks show that green candles are much bigger than the red ones. It is a prominent indication that investors believe it to be a Bullish market.
Moreover, BCHUSD is trading above the 50-day SMA. The 20-day EMA is acting as a support level. It shows that BCHUSD is Bullish in the short-term. However, the 200-day SMA line is way above the current traded price. Therefore, in the long run, BCHUSD is still not Bullish.
It could be an excellent time to accumulate Bitcoin Cash and keep it for the long term.
Latest price analysis of XRPUSD
Ripple is currently on an altogether different trajectory. XRPUSD was once the most liquid cryptocurrency, set to beat the popularity of Ethereum. However, after touching the coveted $0.22 mark, it recently fell to $0.17.
Since then, it hasn’t really taken off. XRPUSD is currently trading at $0.20. However, the traded volumes are pretty low.
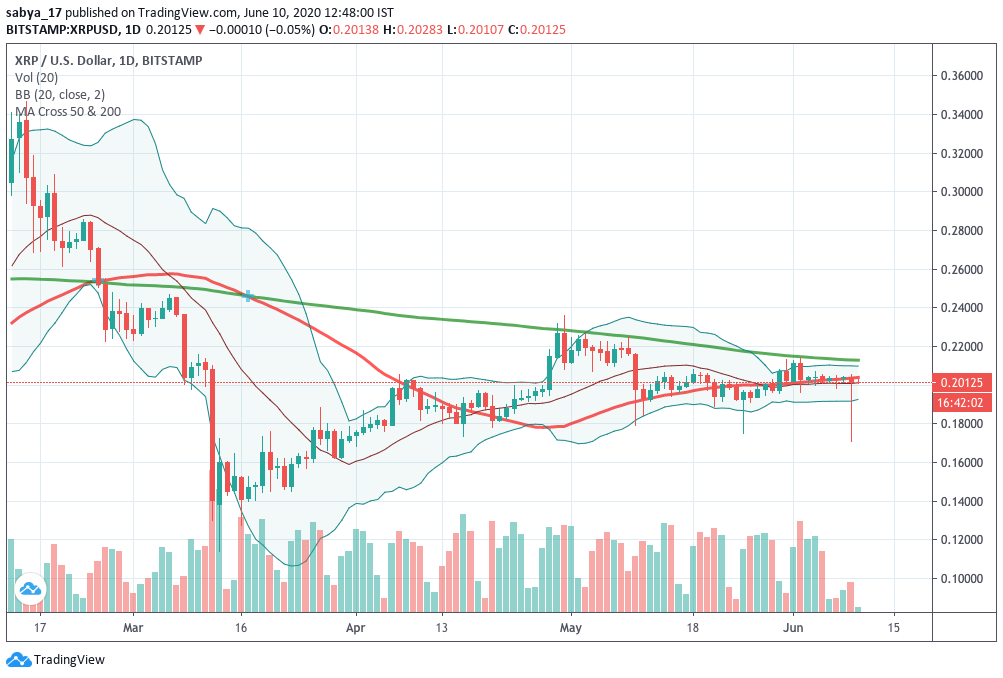
Source: TradingView.com
The daily chart for XRPUSD shows that it is trading below both the 50-day and the 200-day SMA. It signifies that Ripple is Bearish in both the short term as well as the long term.


