

The rebound of Crude oil and the possibility of a peak-point for the number of COVID-19 cases have pushed life back into the financial markets. The major cryptocurrencies such as BTC, ETH, LTC, XRP, BCH, BSV, BNB, XTZ, BCH have all broken their short term resistance levels.
XRPPUSD analysis: Where is Ripple headed?
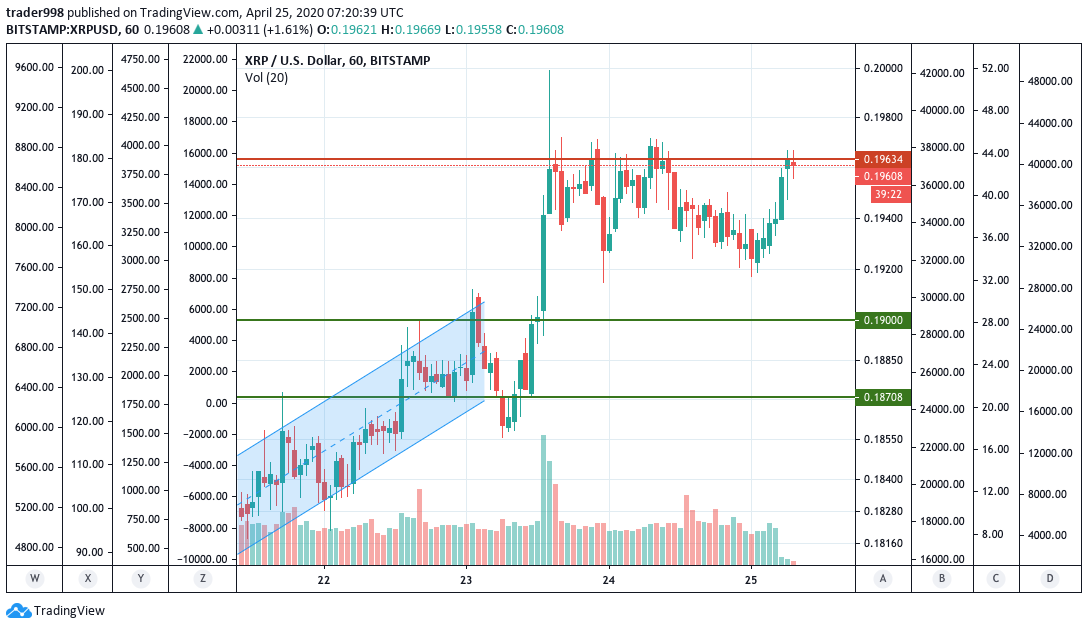
XRPUSD Chart, Source: TradingView.com
- Let’s take a look at the hourly timeframe for Ripple. The day’s range for XRP is $0.19171 — $0.19670. The volume traded is 34.16 million, whereas, the volume traded for Bitcoin is less than 1k. The amount speaks for the popularity of XRPUSD.
- It was quite some time when XRPUSD failed to rise above the $0.19 range. However, with a little bit of push from the BTCUSD price rise, Ripple is now sitting comfortably at $0.195. For now, the bulls seem to be in charge as in the last seven trading sessions of a one-hour timeframe, only one red candle exists. Some analysts hold the view that Ripple could potentially cross the $0.22 mark in the next big move.
Price analysis of ETHUSD
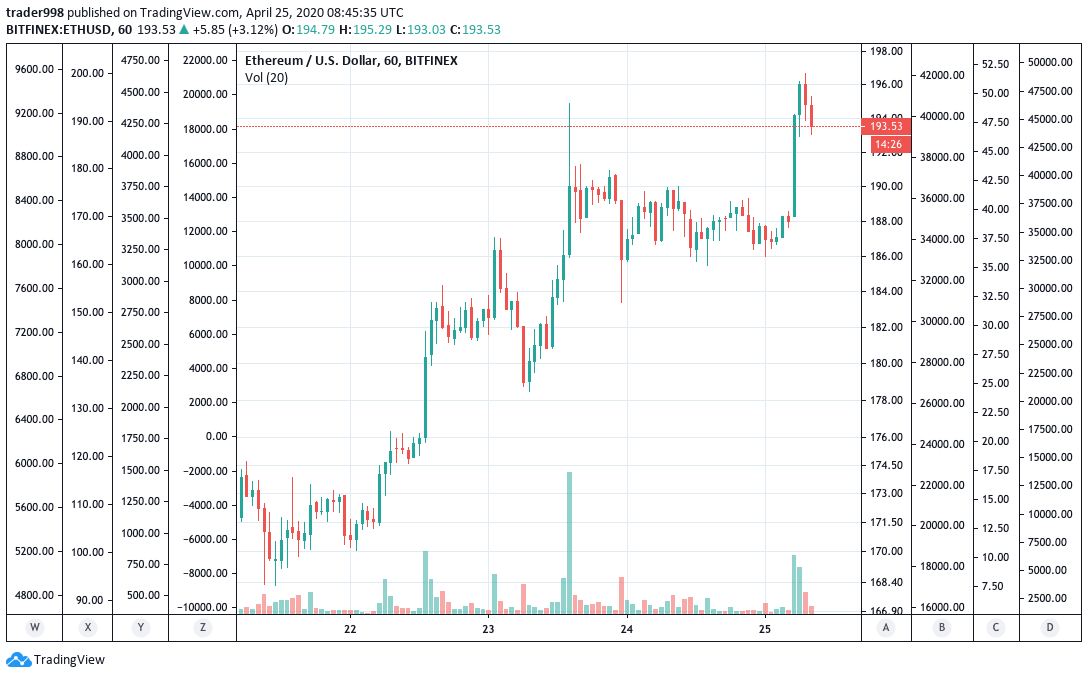
ETHUSD Chart, Source: TradingView.com
- The day’s range for ETHUSD is $185.97 — $197.15. The story of breaking the resistance level is the same for Ethereum as it is for Ripple. ETHUSD faced stiff resistance at $185 for quite some time now. However, now it is comfortably poised at around $194.
- The traded volume is also pretty high. The fact that the day’s high is around $197 makes the claim of ETHUSD crossing $200 pretty soon, a very plausible one.
- The uptrend displayed by Ethereum is far better than any of the other cryptocurrencies. It is even more significant, considering the current economic scenario.


