

Dominant bias for XRP – Bullish
Resistance Levels- 0.6000 $0.6500, $0.7000
Support Level-$0.3500, $0.3000. $0.2500
XRP had a temporary drawdown which is a plus to the cryptocurrency on its journey to the moon. The bullish opening of 18th October at $0.4832 expected to push the price of XRP up showed exhaustion as the candle closes with a wick. This returned the bears to market. The bears’ pressure was strong as XRPUSD initially down to $0.4719. With increased bearish momentum, the cryptocurrency went further down to $0.4560 in the support area as the trading session runs to a close
Apparently, the pullback was necessary for the market correction before uptrend continuation. The retracement was within the 50.0 fib level a trend reversal zone. The implication is that the bulls still lurk in the market and a strong comeback may occur sooner than expected. Moreover, the broken diagonal line in the Fibonacci is another great tool. Each time price touches it, it bounces off it. A bounce may also be expected if price makes a touch at it before going up.
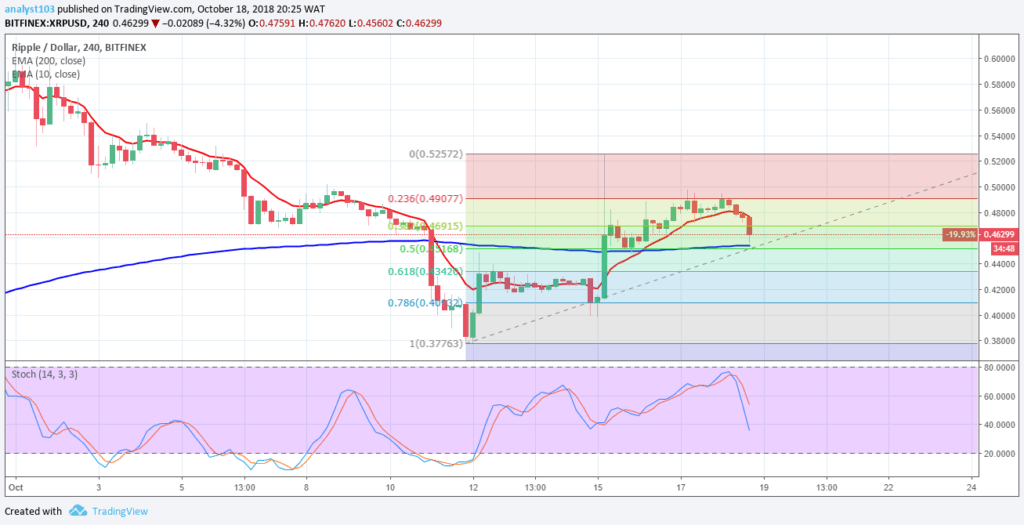
The 200 EMA is seen acting as a strong support for bullish movement as XRP price lies above it. The stochastic oscillator signal points down at 32% which suggest minor downward price movement may occur before uptrend continuation.


