

Dominant bias for STELLAR (XLM): Bullish
Resistance Levels: $0.2700, $0.2900, $0.3000
Support Levels: $0.2000, $0.18000, $0.01600
XLM is in a bullish trend The bullish pressure is much evident as XLMUSD was up $0.2590 at the resistance area 20th on October but briefly lost momentum as the bears stage a comeback. The bear pressure was strong with the cryptocurrency making a low of $0.2431 in the support area on 22nd October but the candle closes as a bullish hammer, a signal to a reversal.
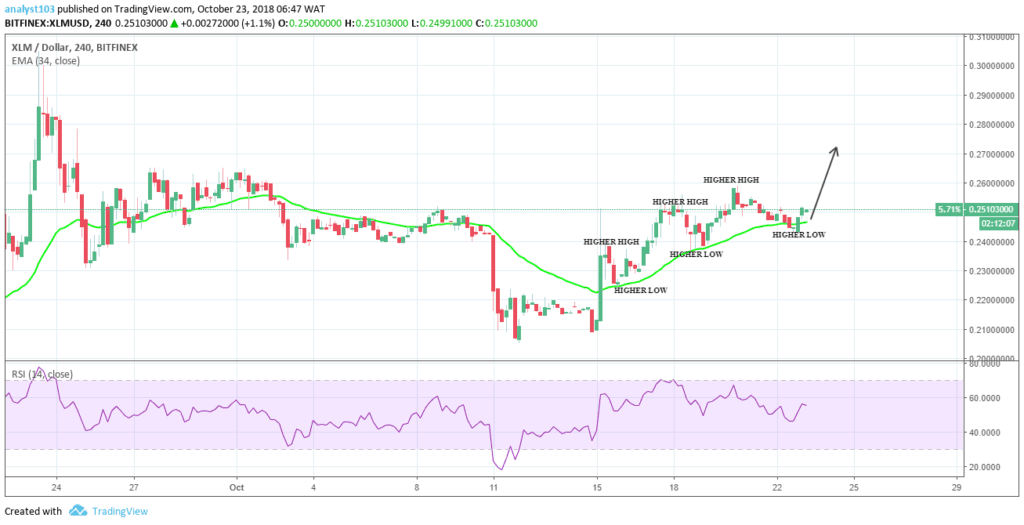
The bulls returned was with a bullish marubozo candle at $0.2434 and XLMUSD was up at $0.2484 in the resistance area before the session ended on 22nd October. The 4-hour opening candle today was bullish and XLMUSD was up at $0.2520 earlier today with more room for upward movement.
Price is above the 34 EMA a strong indication to bullish pressure and the relative strength index is at 55% a buying zone. Moreover, price is forming higher highs and higher lows that are characteristic features of the up-trending market. It implies that the bulls are in full control of the market. As more buyers take a position today the cryptocurrency may retest $0.27000 in the resistance area.


