

Ripple’s momentum is strongly backed by the spectacular rise of BTCUSD before the upcoming halving. This momentum has suddenly caused the indicators to form a bullish outlook for XRPUSD, although in the short term.
Ripple suffered a setback earlier in the past week. Since then, it has been on a recovery mode slowly yet steadily. With the BTC reward halving coming up in just three days, it could be testing times for XRPUSD.
XRPUSD technical analysis and price movement
To understand the short term momentum, let us take a look at the hourly chart for XRPUSD.
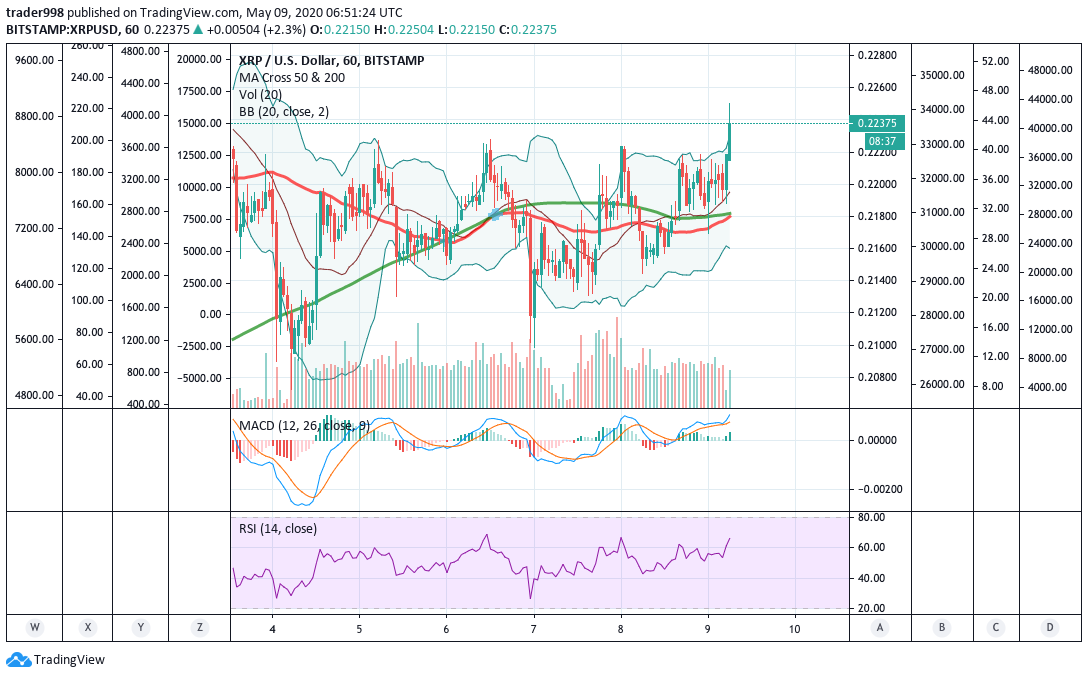
As of writing this article, XRP traded at $0.22359. The day’s range for Ripple is $0.21692 — $0.22504. The two large green candles at the end indicate the increase in buyer power over the sellers. The further observations are:
- Earlier in the week, XRP traded in a channel within the range of the 100-day Exponential Moving Average (EMA) and the 200-day EMA.
- Resistance lies at $0.226, which is the 200-days EMA for Ripple. The next resistance levels lie at $0.235, $0.245, and $0.255.
- The support level for XRPUSD lies at $0.207, which is the 100-days EMA. The next support levels are at $0.20, and $0.192.
- The Relative Strength Index or RSI has turned bullish. The MACD line crossed over and above the signal line, which is yet another bullish indication.
Analysts: Beware of the impending correction in XRPUSD
While Bitcoin raced past the $10,000 mark before the upcoming halving, the road has not been that steady for the altcoins. Investors strongly believe that Ripple could witness a massive correction soon.
Check out XRPUSD Chart on tradingview.


