

The MATIC price twice has failed to cross the trend channel's upper threshold. After coming back from oversold territory, the rejection happened at a critical bearish level on the Relative Strength Index. If $0.86 is breached, then the bearish thesis will be proven false. The MATIC price of Polygon has suggested a significant negative trend. To the untrained eye, however, the signals might not appear prevalent.
MATIC pricing may cause issues
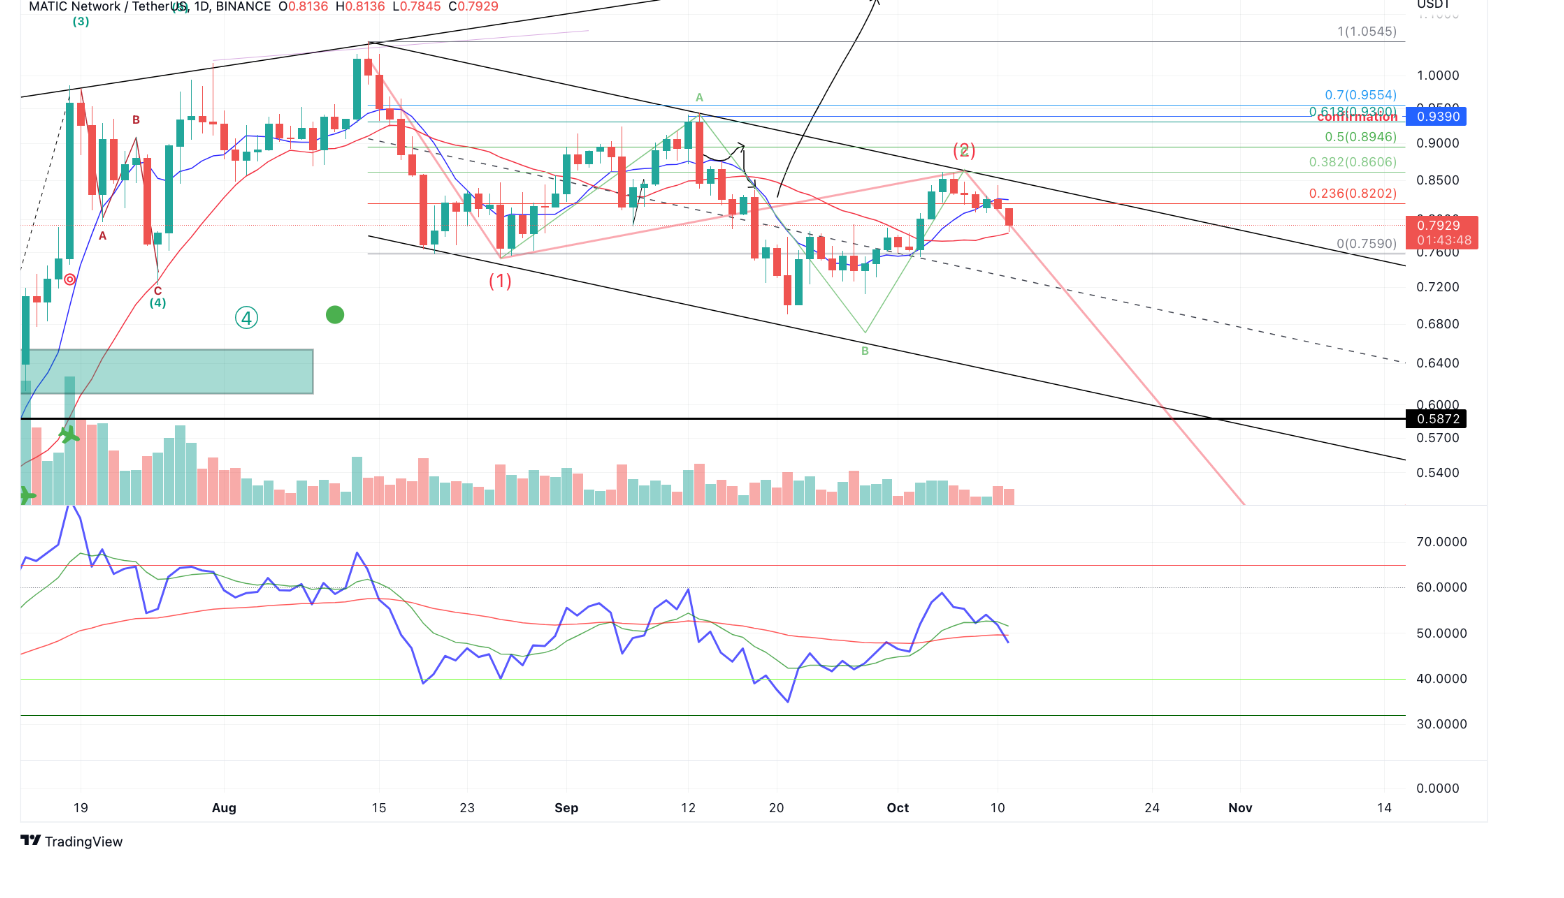
The price of MATIC (1) is down 7% for the month due to the bears' re-entry into the market in the second week of October. The downward movement was sparked close to the top of a similar declining channel that also served as significant resistance in September when the smart contract token was up for auction at about $0.90. The repeated rejections close to the falling barrier may be the first indication of a far more powerful effect on the MATIC price than it first seems.
As a result of the bulls losing position relative to the 8-day exponential moving average, the MATIC price is presently bidding at $0.79. The next level of support, the 21-day simple moving average, is now being tested by the Polygon Network token. If the indication doesn't hold, the downward movement toward $0.62, the bottom of the declining channel, will probably gain strength.
The recent rejection from around the top boundaries of the descending trend channel coincided with a significant bearish, which the Relative Strength Index confuses despite a strong beamish presence. It's important to remember that the bulls reached the resistance level after entering very oversold territory on longer time frames.
What can investors expect in the future?
The Polygon scenario in progress may provide difficulties when it comes to connecting it all. The RSI indicator (2) may indicate that the same bears that drove the market's price into the oversold territory are back in the picture and intend to make fresh lows.
Technical analysis, however, is never a firm promise and is always open to interpretation. If the current swing high at $0.86 is breached, the bearish argument is refuted. A further rise toward the $1.20 liquidity levels may occur if the bulls overcome the resistance. A change like that would cause the price of MATIC to decrease by 50% from its present level.


