

This week has been a rough journey for all the cryptocurrencies. The week started after recovery from last week, and every currency saw an upward trend till 27th August. After that, we saw a decline in almost all the digital currencies, and the downward correction was so strong in the charts that they haven’t recovered from the fall yet.
Bitcoin is known for its trend formations and the affect it has on the whole market. Bitcoin started the week decently at the opening trade price of $10,147.85 on 25th August. Slowly the price saw an upward moving trend in the charts and bulls were pushing hard to reach the major resistance levels of $10,500.
The price did pull up to a new high for the week by reaching $10,389.89 on 26th August. This gave the investors and traders hope that the much needed bullish trend is finally forming after a decline in the price.
27th August showed the trade price of $10,355.80, and then a downward correction was visible in the charts as the price moved downwards towards the support levels of $10,200. This trend continued for the whole day, and the price saw a further downfall.
Things changed when the market saw a sudden dip in the charts as Bitcoin price went down to $9,721.72 from $10,236.48. This was a surprising fall for the market as the price went way below the moving averages of 20-days and 50-days.
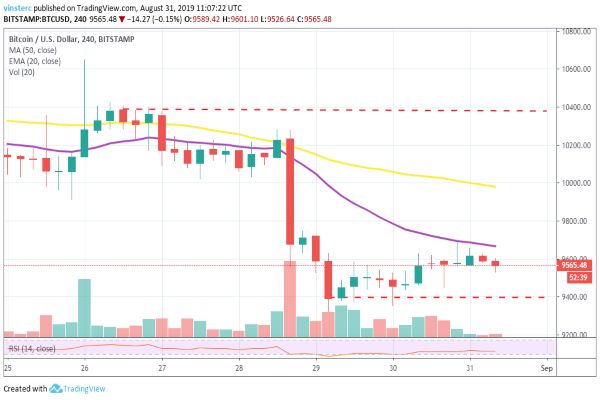
Since 28th onwards, the market has seen a downward trend in the price, and Bitcoin was testing every support level that came it’s way. The price tested the $9,500 major support level as price went down to $9,397.86 on 29th August. Since then the bulls have been trying to provide a push to the market, but we can see strong resistance near the $9,600 levels.
Currently, Bitcoin is trading at $9,565.48 with support levels available at $9,400. If the bulls are not able to provide a push to the price, we can expect the price to test the support levels of $9,000 and $8,800 in the coming week.
ETH/USD
Any change in the trend of Bitcoin affects the whole market of cryptocurrencies, and the same thing happened with Ethereum. Ethereum entered the week by trading at $191.10 and faced a slight decline in the price on 26th August.
This trend changed for a day and showed some bullish movement, but another decline hit on 27th August, and the price reached $188.62. This was the time when the whole market was expecting an upward trend towards the $215 and $240 major resistances. This dip in price was unexpected by the investors, and this left the market in shock.
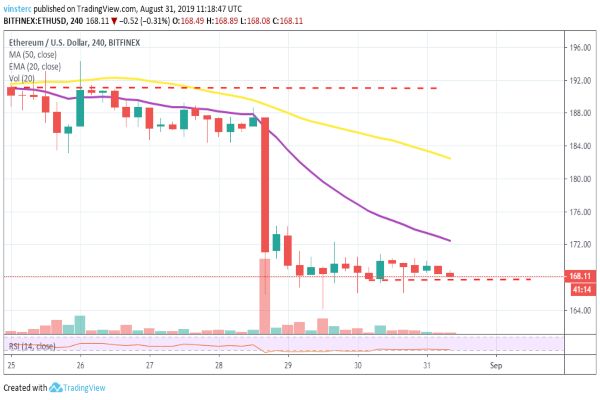
The price further went down from 27th onwards, and by 29th August, ETH had seen a decline of almost $20 in its price. By the next day, Ethereum was trading at the weeks lowest price of $167.76. Strong resistance was seen forming near the $172 levels as it trades below the moving averages.
Currently, ETH is trading at $168.11 with resistances forming at $170 and $172. If the bulls fail to defend this spot, we can see the price testing the support levels of $165 and $160 in the coming week.
XRP/USD
Ripple started the week at a very decent note with the XRP token trading at the levels of $0.27207 on 25th August. The moving averages and charts were almost moving together, but XRP picked up a bearish trend from 26th onwards, and it has been continuing in the downwards direction ever since.
The highest trade price for the week was on 25th August at $0.27541. The downward correction was testing the support levels of $0.2580 and $0.2560. The decline continued till 29th where the price was at its lowest for the week-$0.25102.
A slight bullish trend can be seen forming in the charts from 29th onwards and currently, XRP is trading at $0.25753. This bullish trend can be seen as a positive sign that things might go well in the coming week, but we’ll have to be prepared for a further decline as well.
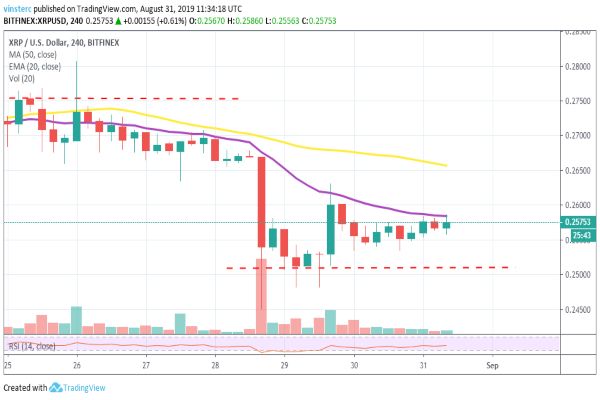
Strong resistance can be seen near $0.2590, and $0.2600 as the 20-day EMA comes almost parallel in the bar. 1st September will decide things might end up in the coming week, but a slightly bullish trend is a relief for the investors.
LTC/USD
As we look at the weekly chart of XRP and LTC, we can see a familiar trend formation in the charts, the trade price opened the week decently, but with a slight bullish push and prices went down to test the support levels.
LTC opened the trade gates on 25th August at $73.45, and there was a downward correction in the price before it picked up again on 26th. For the next 3 days, the trade price was moving parallelly with the moving averages, but they all were facing downwards.
On 28th August, Litecoin was trading at $72.30 before it faced a sudden decline and went down to $65.94. Since then the price kept a bearish trend, and on 30th August it reached the week’s lowest price of $62.87.
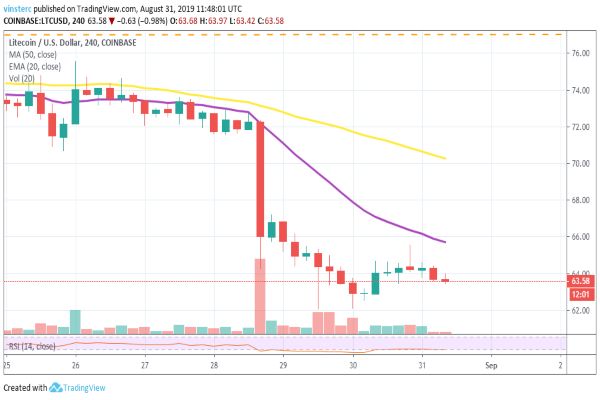
Currently, it is trading at $63.58 with a strong resistance forming at $65. Support levels for the coin are available at $60 and $58. It’s hard to say whether the next week will be beneficial for the bears or the bulls, but from the chart, we can expect an upward trend in the coming days. The RSI is below 50 for LTC.
BCH/USD
Bitcoin Cash had a great start for the week as compared to the other cryptocurrencies. The trend line was moving parallel to the moving averages till 28th, but a sudden downward correction of the chart changed things for Bitcoin Cash.
BCH started the week at $305.99 with a bullish trend in the chart. The price continued to rise until the resistance point of $315, but it couldn’t go further than $312.16 on 27th August. Since that day a trend of downward correction was forming in the chart, and a considerable drop came around 29th August. The price went from $308.04 to $277.82 by 30th August.
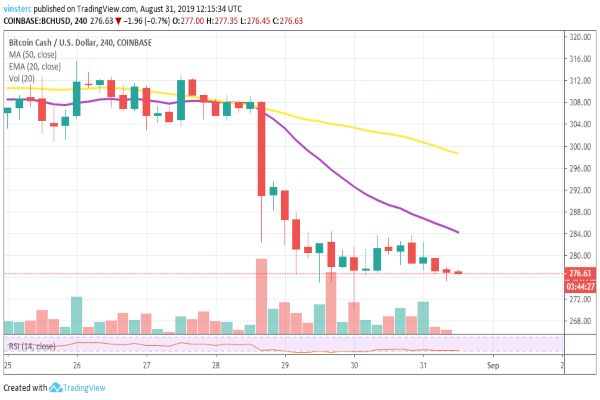
Currently, BCH is trading at $276.63, and the chart is suggesting a further decline in the price. So we can expect the price to test the $270 support levels in the coming week. If the bulls can break the trend and provide a push, we can expect the price to go to $295 levels.


