

Dominant bias for STELLAR(XLM)- Bearish
Resistance Levels- $0.2400, $0.2500, $0.2600
Support Levels- $0.2000, $0.1800, $0.1600
Stellar is in a bearish trend. $0.2276 in the resistance area was the point the bullish pressure from the pinbar of 29th October lost momentum. The bearish hammer formed at $0.2260 signaled the bears returned. XLM was down to $0.2225 at the support area before the close of yesterday session.
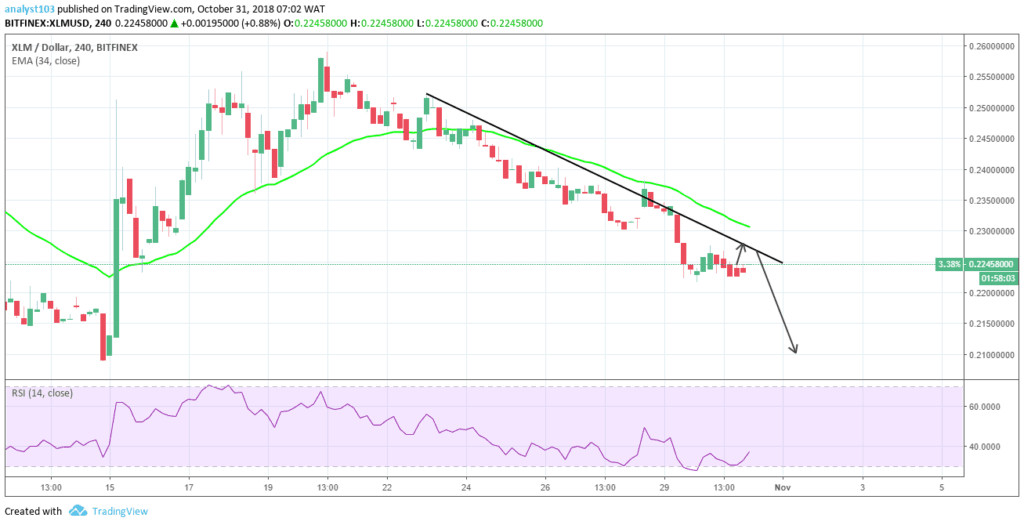
The bearish 4-hour opening candle $0.2239 shows divergence with the relative strength index. The index is at 34% and it signals points up which implies bullish momentum but the Stellar price is going down. It implies we may see some bullish movement to the upside and possibly to the edge of the downward trendline.
Each touch on the trendline produces a bounce to the downside. The current bullish movement should be seen as a retracement necessary for the market correction before downtrend continuation.
$0.2100 may be retested as the bearish pressure becomes much stronger.


