

Bitcoin has been facing trouble finding the right bullish pace in its price from the past few days as September ended with a bear run as the price went down. Similar trends were seen in the rest of the altcoins as well as the prices saw a decline and the price tested the significant support levels of every cryptocurrency.
The last week of September has been a tough one for cryptocurrencies as, despite the hard push by the bulls, the price continued to stay in the bearish zone. The price took another dip as the price continued to declined and tested the support levels before gaining the bullish trend.
With the beginning of the new month, there have been slight changes in the charts as the prices have started an upward correction in the charts as the prices head towards the resistance zones. Bitcoin moved from yesterday’s $7,600 level to up towards the resistance level of $8,500.
Currently, Bitcoin is trading at $8346.66 as the upward correction gets stopped by the strong resistance present at $8,500 level. Immediate support can be seen, forming near the support level of $8,100 as the price struggles to head towards the resistance level.
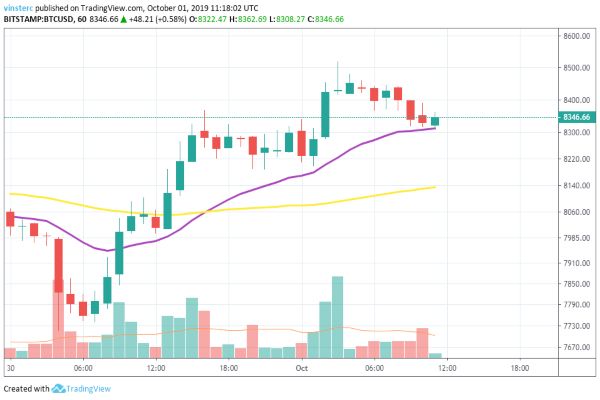
If the bulls continue to defend their position and keep the price above the $8,200-$8,300 levels, then we can expect the price to push beyond the $8,500 resistance level and aim for the key resistance levels of $9,000 and $9,200.
In case a downward correction takes place, we can expect the price to reach the support levels of $8,100-$8,000, and further decline will take the price to test the support levels of $7,800 and $7,500. The hourly MACD is moving towards the bullish zone as the RSI moves above the 50% zone.
ETH/USD
Ethereum also started the month fresh after facing a massive decline in the past few days. Ethereum reached the month’s high of $224, and it came crashing down to $160 levels in just a few hours. The trend is changing now as the bulls are trying to take control of the market.
Currently, ETH is trading at $181.11 as the price gained back the momentum after testing the support level of $166. The 20-days and 50-days moving averages are moving upwards as the bulls enter the market. Strong resistance can be seen, forming near $186 as the price struggles to push through. Immediate support is forming near $176 as the price continues the upward movement.

In case a downward correction occurs in the charts, we can expect the price to move towards the $176 and $174 support levels. A further fall will make it test the support levels of $172 and $170. If the bullish trend continues, we can expect the price to go above and aim for the resistance levels of $185, and if the price manages to break that, it can further aim for the $200 significant resistance.
XRP/USD
Ripple is also meeting the bulls after a long time as the price has finally decided to climb up after trading near the $0.2390 support levels. Sudden push in the price up as it broke the resistance levels of $0.2560 and $0.2600.
Currently, XRP is trading at $0.2569 as strong resistance can be seen forming near the $0.2650 level. Immediate support can be seen, forming near the $0.2520 as the price continues the upward trend. The MACD is about to move into the bullish zone as the moving averages begin an upward journey in the charts.
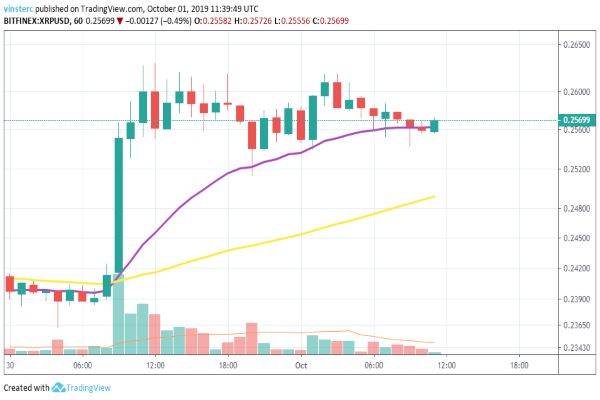
If the bullish trend continues, we can expect the price to head towards the resistance levels of $0.2650 and $0.$2680. A further push will take XRP to aim for the resistance levels of $0.2700 and $0.2750. In case the bears take over the market, we can expect the price to move towards the support levels of $0.2520 and $0.2500. A further pull will make the price test the support levels of $0.2480 and $0.2400.
LTC/USD
Litecoin has gained some momentum with the recent bull rush in the markets as it moved away from the support level of $52 and broke the resistance level of $55. This slight bullish trend is continuing in the charts, and the price struggles to move upwards.
Currently, LTC is trading at $56.20 with immediate support forming near $55, and a strong resistance can be seen near the $57-$58 levels. The RSI is above 50% as the price is trying hard to maintain a bullish trend.
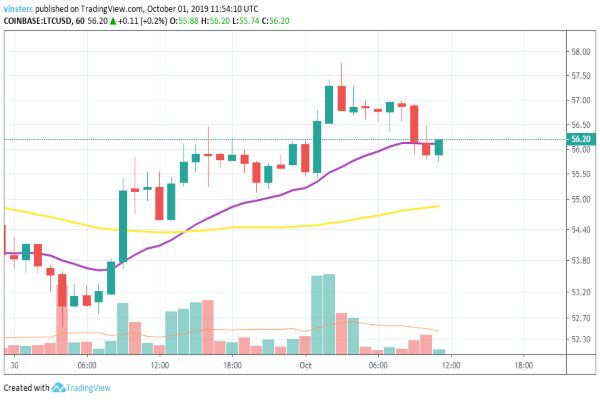
In case the bullish trend continues, we can expect the price to break the $57 resistance and aim for the key resistance levels of $60 and $64. If a downward trend enters the charts, we can expect the price to go down towards $55 and further test the support levels of $53 and $50.
BCH/USD
Bitcoin Cash is making its come back in the market as the price has started gaining its lost value in the market. After testing the support levels of $214-$212 yesterday, the price witnessed a bullish trend, and the price started an upward correction again.
Currently, BCH is trading at $229.54 as the price came down after testing the strong resistance present at $235. Immediate support can be seen, forming near the $224 level. The RSI for BCH is moving slightly above the 50% level.
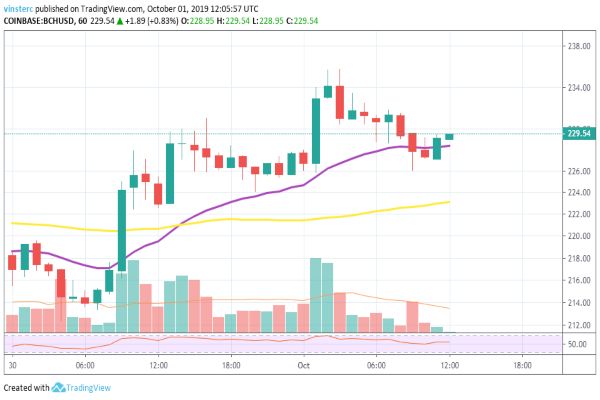
In case the bulls give a push again, we can expect the price to break the strong resistance present at $235 and aim for the major resistance levels of $240 and further aim for $250 level. If the bears take over the market, we can expect the price to test the support level of $224 and further take the price to test the support levels of $220 and $215.


