

A stable trend can be seen in the market as the price trade close to the resistance levels while the lower levels support them well. Once in a while, the bulls try to change the trend, but the bearish dominance in the market comes to play, and the price gets pushed back to the support levels.
This stability in the charts is considered as a better option as compared to the downfalls that the crypto market faced in the last few weeks. Ethereum moved towards the resistance levels yesterday, but the rise was short-lived as it came back near the support levels after some time.
Bitcoin is trying hard to push beyond the resistance levels, but bears have got their claws deep in the market charts as the price struggles to go beyond the resistance levels. BTC made a run towards the $8,400 resistance levels, but it failed, and the price came down to $8,100 levels.
Currently, Bitcoin is trading at $8215.65, as strong resistance can be seen near $8,400. The price struggled to go beyond $8,400 levels, with an immediate support level forming near the $8,100 levels. The RSI is declining slowly below the 50% level as the price starts a slow decline in the charts.
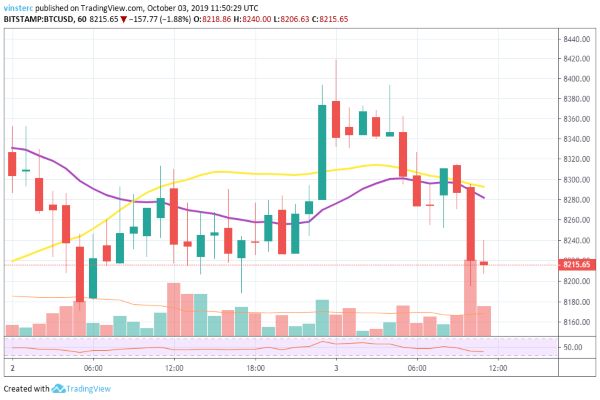
In case the price continues to decline, we can expect the price to the $8,100 level, and any further decline will make the price test the support levels of $8,000-$7,800. If the bulls take control of the market, the price can move towards the resistance levels of $8,500, and it can also aim for the $8,800 levels.
ETH/USD
Ethereum started a climb towards the major resistance level of $186, but this climb was again stopped at $182 resistance level as the price began another downward trend.
Currently, ETH is trading at $176.82 as the price continues the downward trend in the market. Strong resistance can be seen near the $182 level, while $174 support levels well support the price. The RSI is slowly going below 50% as price faces a downfall in the charts.
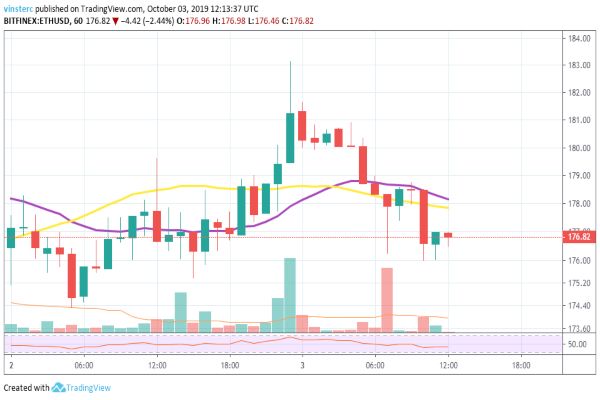
In case of an upward correction, the price can aim for the resistance levels of $182 and $185 and further head towards the major resistance levels of $195 and $200. If the bear attack comes back, we can expect the price to head for the support levels of $174 and $172. Further decline in the price will take the price towards the support levels of $170 and $168.
XRP/USD
Ripple continues to struggle to move beyond the $0.2550 resistance level as the price continues to struggle to climb up the charts. The downward correction takes over as the price heads towards the support levels of $0.2460.
Currently, XRP is trading at $0.2492 with strong resistance present at $0.2550, and the immediate support is available at $0.2460. The RSI is close to 50% but on the lower side. The fluctuations in the charts can expect the price to further decline towards the support levels.
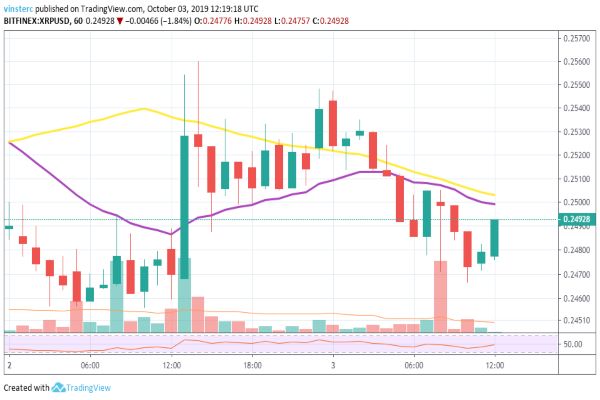
In case the downward correction continues, we can expect the price to move beyond the support levels of $0.2460 and test the support levels of $0.2420 and $0.2350. With the entry of a bullish trend in the charts, we can expect the price to cross the resistance level of $0.2550 and head towards the major resistance levels of $0.2600 and $0.2650.


