

Bears currently surround the market for cryptocurrencies as the prices struggle to reach the resistance levels. Bitcoin, Ethereum, and Ripple are facing a downward correction as the price continues to decline towards the support levels.
Bears have been dominating the market from the past few weeks now, and any effort carried out by bulls to change the trend goes in vain. Bitcoin and tokens are stable in trading below the respective resistance levels, but they are testing the support levels as the decline continues.
The volatile behavior of the market is driving people away from the crypto market, and with the recent talks about another recession hitting the U.S. has made gold a popular option for investment as compared to the cryptocurrencies.
Bitcoin is suffering from a bear attack as the price currently trades around $8,159.25, and the price is following a downward trend with minor uplifts in-between. Strong resistance can be seen near $8,300 as the price struggles to climb beyond that point. Immediate support is present at a $7,950 level.
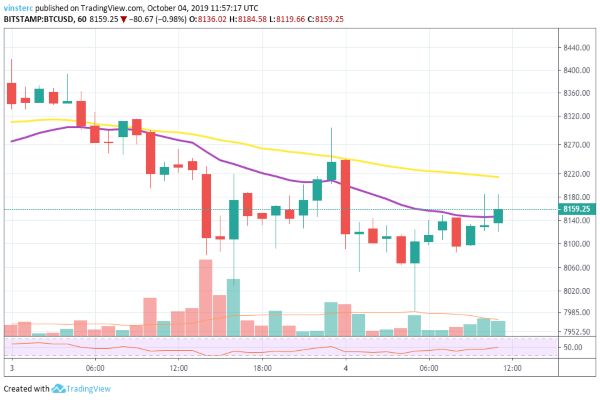
In case of a downward correction, we can expect the price to reach the $8,000-$7,900 support levels, and any further decline can take the price towards the support levels of $7,800 and $7,600. A bullish trend in the charts will take the price towards the resistance level of $8,300 and head towards $8,500. If the price breaks these two levels, then the price will aim for the key resistance levels of $8,800 and $9,000.
ETH/USD
Ethereum is under pressure as a wave takes formation in the charts because of the price fluctuations. Ethereum is teasing the support levels as the price trades close to the $176 resistance level.
Currently, ETH is trading at $175.50 with strong resistance present near $177 level, and support can be seen forming near the $171 level as the price slows slightly upward correction in the charts. The RSI is above 50%, so we can expect another bullish effort in the charts.
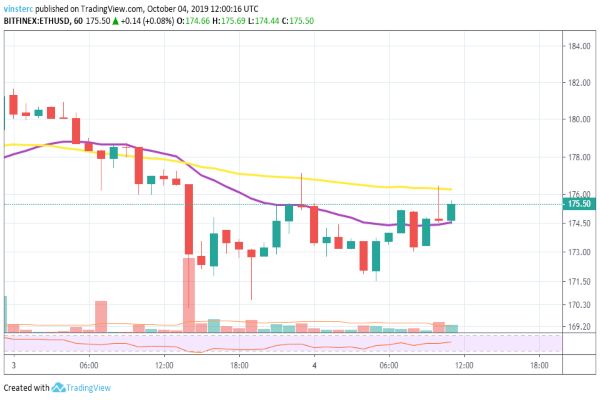
In case the bulls succeed with the push, we can expect the price to head towards the resistance level of $177 and head towards the major resistance level of $185. If the downward trend continues, we can expect the price to go towards the $170 levels and further test the support levels of $165 and $162.
XRP/USD
Ripple has struggled to pass the $0.2550 resistance level as the price witnessed a decline towards the support levels of $0.2430. The bulls are trying hard to provide the right push to XRP so that the price surges towards the major resistance levels.
Currently, XRP is trading at $0.2531 as price faces strong resistance near the $0.2550 level, and immediate support can be seen forming near the $0.2440 level. The RSI has gone well above 50% as the hourly chart shows the formation of a bullish trend.
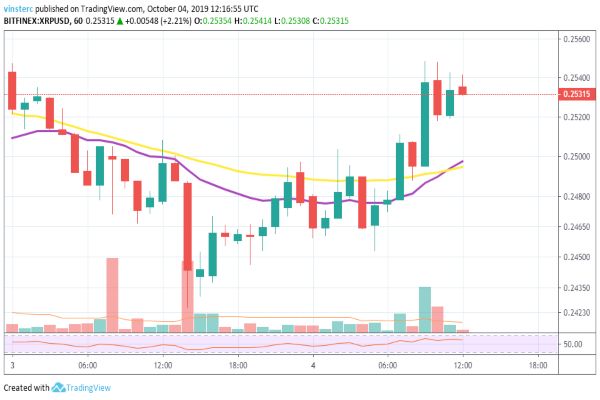
In case the bulls dominate the market, we can expect the price to reach the resistance level of $0.2550 and further head towards $0.2620 and $0.2650. If downward correction takes over the market, we can expect the price to test the support levels of $0.2420 and $0.2350.


