

Last week has been tough on the cryptocurrencies as slightly bearish trends were seen in the charts of BTC, ETH, and XRP as they struggled to head towards the resistance levels. Last week Bitcoin faced rejection near the $10,400 resistance levels.
With this rejection near the $10,400 resistance level, Bitcoin saw a further decline in the price as the trading price tested the support levels of $9,600 during the week and by the end of the week, Bitcoin was trading below the $10,100 resistance levels.
Currently trading at $9,910.42 as the price faces a downward correction with immediate support forming near the support levels of $9,800. Strong resistance can be seen, forming near the $10,080 level as the price fails to push through.
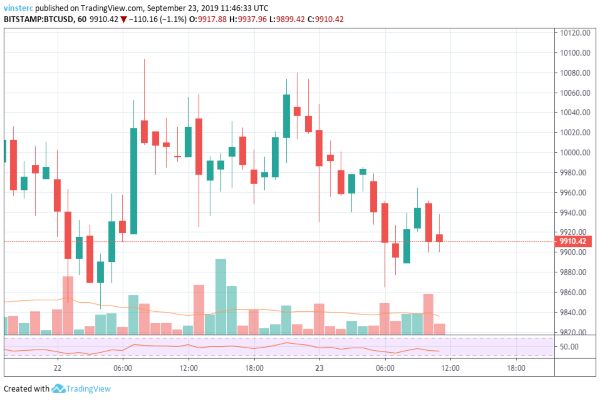
If the bearish trend continues in the charts, we can expect the price to go further down and test the support levels of $9,600 and $9,400. Bullish push in the charts will take the price towards the resistance levels of $10,200 and further towards $10,400. If the price closes near or above $10,400 in the coming days, then a push towards $11,000 can be expected by that seems unlikely right now.
ETH/USD
The past week was a lucky one for Ethereum as the charts faced a strong bullish trend as the price moved towards the $224 resistance levels. This push, however, slowly decreased as the price started correcting lower. The price is facing trouble around the $212 and $215 levels.
Currently, ETH is trading at $210.29 as strong resistance can be seen forming near the $212 level as the price struggles to pass through it. Immediate support can be seen forming near the $206-$208 levels as the price continues with a slight downward correction.
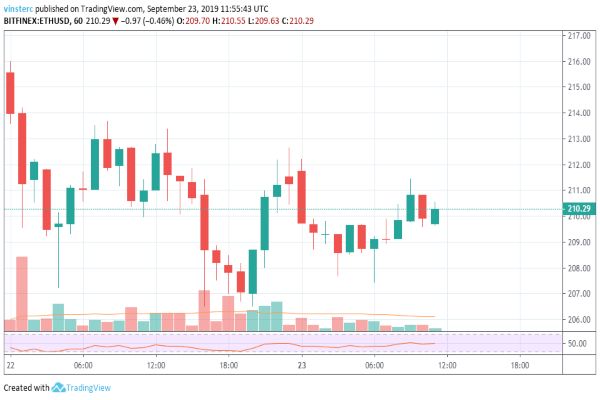
In the coming days, a bullish trend in the charts can take the price beyond the resistance levels of $212 and $215 and aim for the significant resistance level of $224. The further downward correction in the price will take the price towards the support levels of $206 and further test the support levels present at $200-$202.
XRP/USD
Last week has been a good one for XRP as the price tested the resistance levels of $0.3100 as the bullish trend continued in the chart for the whole week. XRP is now facing a downward correction as the price is coming down to test the support levels.
Currently, XRP is trading at $0.2745 with the strong resistance forming near $0.2790 level, and immediate support is present at the $0.2690 level. The price is facing a downward correction after staying bullish for the past few days. If the downward trend continues, then we can expect the price to head towards the support levels present at $0.2690 and $0.2680.
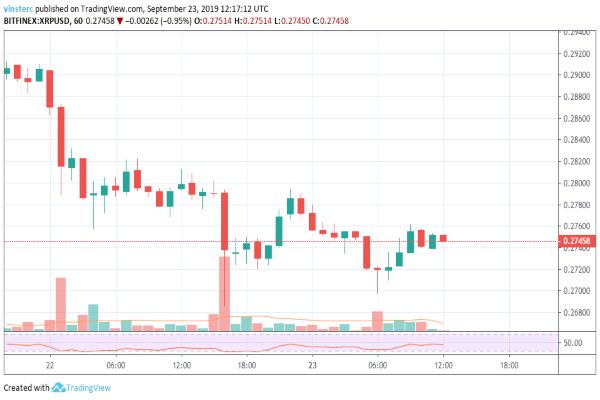
Any further decline in the price will take XRP to test the support levels of $0.2620 and $0.2580. A bullish trend in the charts will take the price towards the resistance level of $0.2820 and $0.2850. Further push in the price can take XRP to the 50% Fib level of $0.2920.


