

Dominant bias for IOTA (MIOTA – Bearish
Resistance Levels- $0.6000, $0.6200, $0.6400
Support Level-$0.4600, $0.4200. $0.4000
IOTA is in a bearish trend. Price is conspicuously below the 50 exponential moving average couple with rejection to upward bullish movement at the 50.0 fib level a trend reversal zone. This clearly reflects the bears market dominance. After dropping the cryptocurrency at $0.4964 in the support area the bears briefly lost momentum. This was informed by the bullish railroad. IOTUSD was up to $0.5066 in the resistance area which was the 38.2 fib level a trend continuation zone. This suggests that downward price movement may continue as the bearish pressure gets stronger
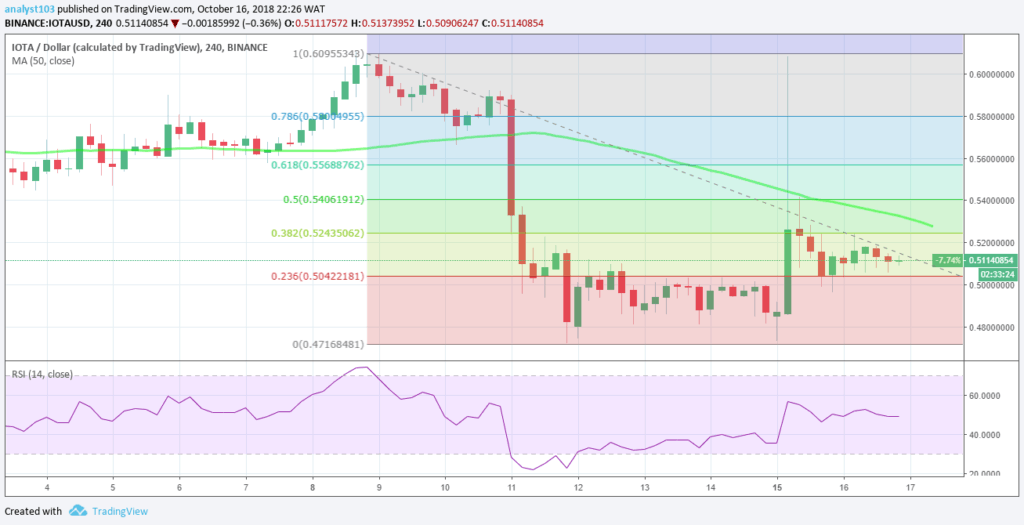
IOTA was down to $0.5057 in the support area and with the relative strength index at 49% and pointing down, the bears may push price further down and find 23.6 fib area a good place to drop the cryptocurrency as its journey south.


