

Technical Indicators:
Support Levels: $140, $139
Resistance Levels: $143, $145
Key Points:
- After rising up to $146, Ethereum price started to correct downwards and tested the support around $139 and $140.
- A lot of buyers emerged around $140 and $139 support levels and pushed the price back upwards.
- ETH was able to break through a bearish pattern line which was formed with resistance around $141 on the hourly chart.
- Ethereum price is currently moving upwards and might test $145 resistance level soon.
Ethereum Price Analysis:
Summary: Ethereum price is well supported at around $139 and $140. ETH is currently moving upwards and might soon test $145 resistance level.
Ethereum price started to correct downwards after rising up to $146. ETH moved below $142 support level and tested the support around $139 and $140. Buyers were able to push the price upwards from this range. Ethereum started an upward correction from the 100 hourly SMA and $139 support and soon moved above $140.
ETH was able to break through a bearish pattern line which was formed with resistance around $141 on the hourly chart. Ethereum price was able to close above $142 resistance level and but is currently facing a lot of sellers around $143. However, the major resistance lies at $145 above which the next resistance is at $150. If ETH price is able to break through $143 and $145 resistance, the overall momentum should turn quite bullish and Ethereum might even break through $150 resistance in the short term. The major support lies around $140 and $139 below which the price might turn bearish.
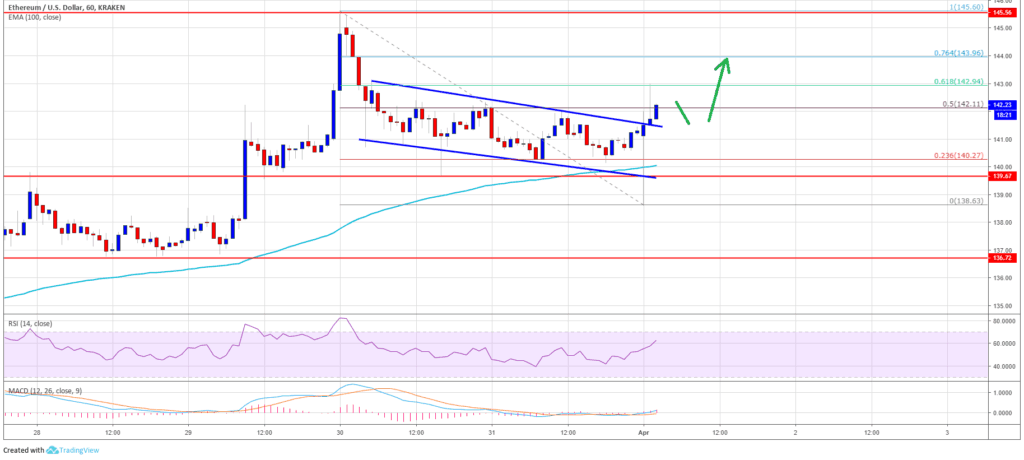
The chart shows that Ethereum price is well supported at $139 and $140 support levels and the 100 hourly SMA. If Ethereum is able to remain above this support range and break through the $143 and $145 resistance levels, it might soon move above $150. However, a break below $139 support level will turn the overall momentum bearish.


