

Bias for ETHEREUM (ETH) – Ranging
Resistance Levels – $250, $270, $290
Support Levels – $160, $150. $140
ETH had been in a ranging scenario in its long-term outlook for some weeks now. Since 5th September that the bears broke the critical price at $240.00 with a large engulfing candle, the cryptocurrency had not made an appreciable movement either to the north or south.
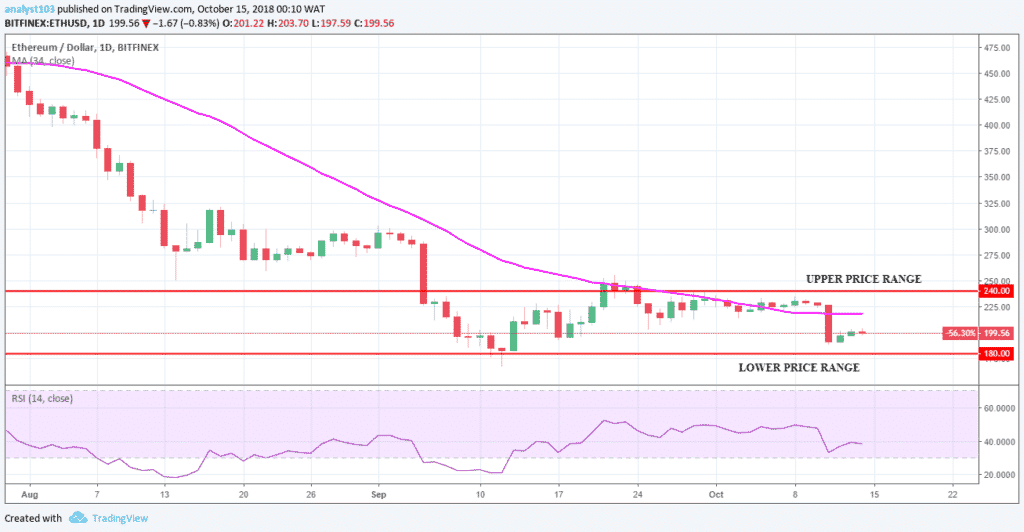
Price is below the 34 EMA an indication to strong bearish pressure within the range. The bearish marubozu candle at $226.70 on 11th October was bears’ determination to continue the journey south but this was rejected as bulls gradually stage a comeback.
The cryptocurrency is ranging and trading between $240.00 in the upper supply area and at 180.00 in the lower demand area of the range. The days ahead may provide a clear picture with either a breakout at the upper supply area or breakdown at the lower demand.


