

Dominant bias for Bitcoin (BTC) – Bearish
Resistance Levels – $8000, $8500, $9000
Support Levels – $6000, $5500, $5000
BTC remains in a bearish trend. The bears had little impact on price with BTC dropped to $6305. 00 before the end of yesterday session. The 4-hour opening candle at 6336.40 was bullish. This created a bullish railroad which was a signal to the bulls returned. BTC was up at $7788.00 in the resistance area earlier yesterday. The 4-hour candle closes with a wick with almost 50% of the upward movement returned.
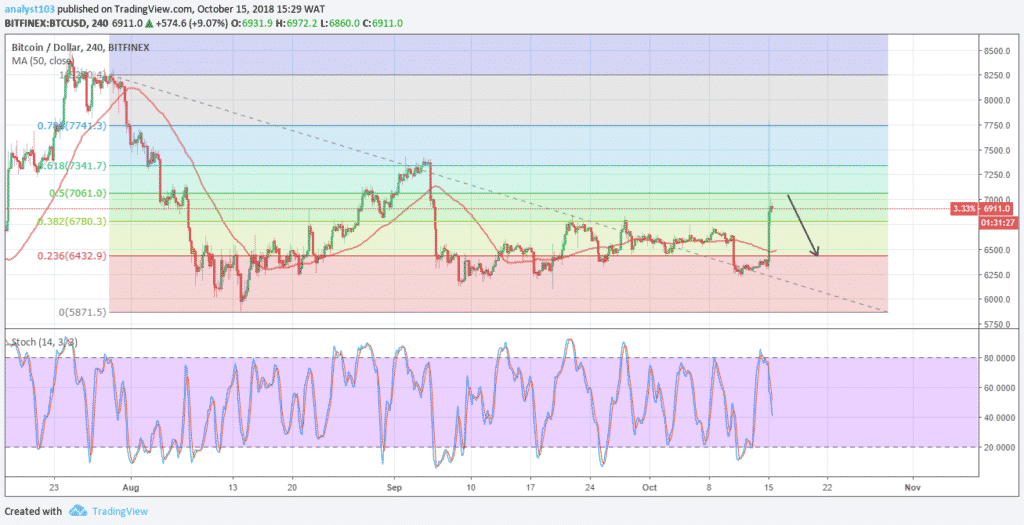
The stochastic oscillator is at 44% and its signal points down a divergence from the price. This implies downward momentum in price of the cryptocurrency in the medium-term
With Fibonacci retracement, BTCUSD made a 78.6 pullback of the move that started since August and returned back 38.2% four hours. The downtrend continuation remains sacrosanct as BTCUSD may lose 23.6% of the earlier move due to the bears continued pressure. It, therefore, implies that the earlier move may be a fake-out to trap buyers as the bears returned to sustained the downtrend.


