

BTCUSD Dominant Trend: Bearish
Resistance Levels: $9500, $10000, $10500
Support Levels: $7000, $6500, $5000
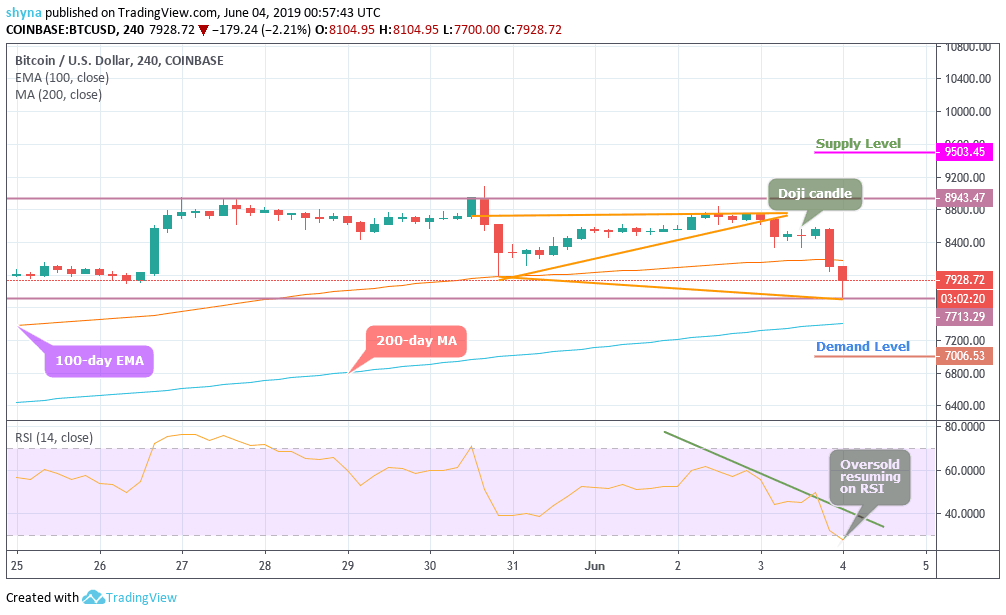
Bitcoin price, once again, fell below $8,000, after a massive sell-off that caused prices to fall to $7,900, according to the 4-hour chart. Late Monday afternoon, the world’s largest market capitalization cryptocurrency began to fall sharply, losing more than $700 in value due to a significant volume. For several days, BTC did not exceed $8,800, which led to a new test of the previous supports as it struggled to pick up a bid. At a drop of 8.26%, Bitcoin price is struggling to find a balance just below the psychological price of $8,000, the intensity of the decline continues despite the high volatility. On the 4 hour chart, the RSI produced the lowest oversold lower lows, supporting the lower lows on the price.
Meanwhile, as it successfully crossed the 100-day EMA and about to move to the 200- day MA with the RSI 14 signal line heading towards the oversold territory, the $7,000 demand level should be able to hold it, else, it causes a serious downward trend for the crypto. In any case, as long as the 200-day moving average is not exceeded, there is likely to be some kind of setback that allows buyers to regain their strength. If this happens, the currency will rebound to resume the bullish movement and this time it will probably reach the level of supply at $9,500 and above. However, be careful, since this sudden drop could be part of a larger movement to raise prices.


