

Crypto markets are alive again, now that the Bitcoin price has regained public interest, who now realizes that they missed their chances to buy the bottom along with the growing interest, and trading volume surging so strong that it knocked out a number of crypto assets, volatility is also picking up significantly once again.
BTCUSD Dominant Trend: Bullish
Resistance Levels: $14,500, $15,000, $15,500
Support Levels: $9,500, $9,000, $8,500
Bitcoin Price Analysis
Bitcoin price traded above $12,300 level yesterday and it showed a healthy gain of 9.26% on the day. It is nearly impossible to predict where Bitcoin is headed next, however, at this very moment; the bulls are attempting to resume the uptrend, but could face some resistance at $13,000. The buyers are still trading in a bull market, and just because they are correcting doesn’t mean that they are out of the bull market. Now the Bitcoin price has climbed its way back moving above $12,000 resistance level again almost as fast as it dropped, with a 14 percent increase over the past 24 hours. BTC/USD was trading around $12,400 before which happened to be the highest price that Bitcoin was trading, and currently, it’s around $12,300 level. Meanwhile, $11,000 level has turned from a resistance back into a support level. Few resistance points have been identified between here and around $14,500, although there was some major selling pressure around here last time.
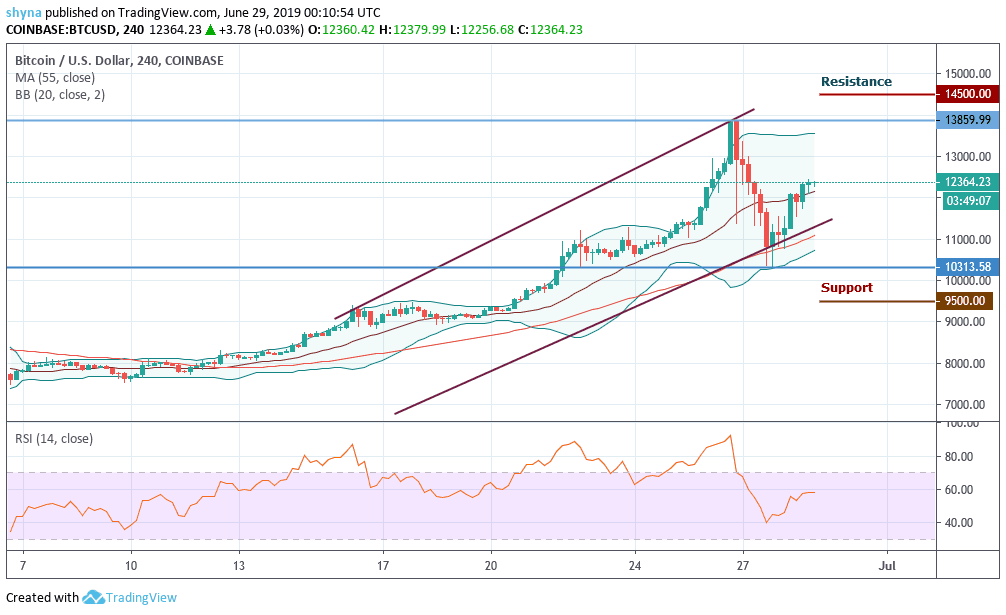
Furthermore, if Bitcoin can stay above the newly target $12,500 level, a new ATH level around $15,000 doesn’t look too far away. At the time of writing this report, Bitcoin had just climbed to $12,320 level, which represented a new high since June 27, before the sudden fall, the Bitcoin price is moving so fast and may likely bidding farewell to the $10,000 level as reveals by the 4-hour chart. The bulls have gained back some momentum as the price moves northward, trading above the $12,300 level after the crash of June 27. The market price is trading above the moving average with a period of 55, which indicates an upward trend in Bitcoin and is already crossing the middle line of the Bollinger Bands indicator. The closest resistance level is around $13,000 to $14,000 in which the bulls are eyeing. Breaking this would probably send the Bitcoin price to the levels of $14,500, $15,000 and $15,500. On the downside, the possible support levels are $9,500, $9,000 and $8,500 with RSI 14 indicator moving above level 50 which indicates an uptrend.


