

- The day’s range for BTC is $7,090.35 — $7,220.00.
- BTCUSD continues to be comfortably above the 50, 100, and 200 Moving Averages.
Factors impacting Bitcoin demand are:
- COVID-19 cases are decreasing in several parts of the world. Some of the largest economies are likely to reopen their businesses soon.
- Bitcoin halving is going to take place in May. Historically, after every halving, the BTCUSD prices have shot up exponentially. Going by that trend, it is only logical that investors are keen on stocking up their Bitcoin portfolios.
- Recent data shows that a lot of institutional investors are investing in Bitcoin. Various hedge funds are making huge investments in different cryptocurrencies, including BTC.
Here’s a look at the BTCUSD technical analysis
BTCUSD Chart Published on TradingView.com
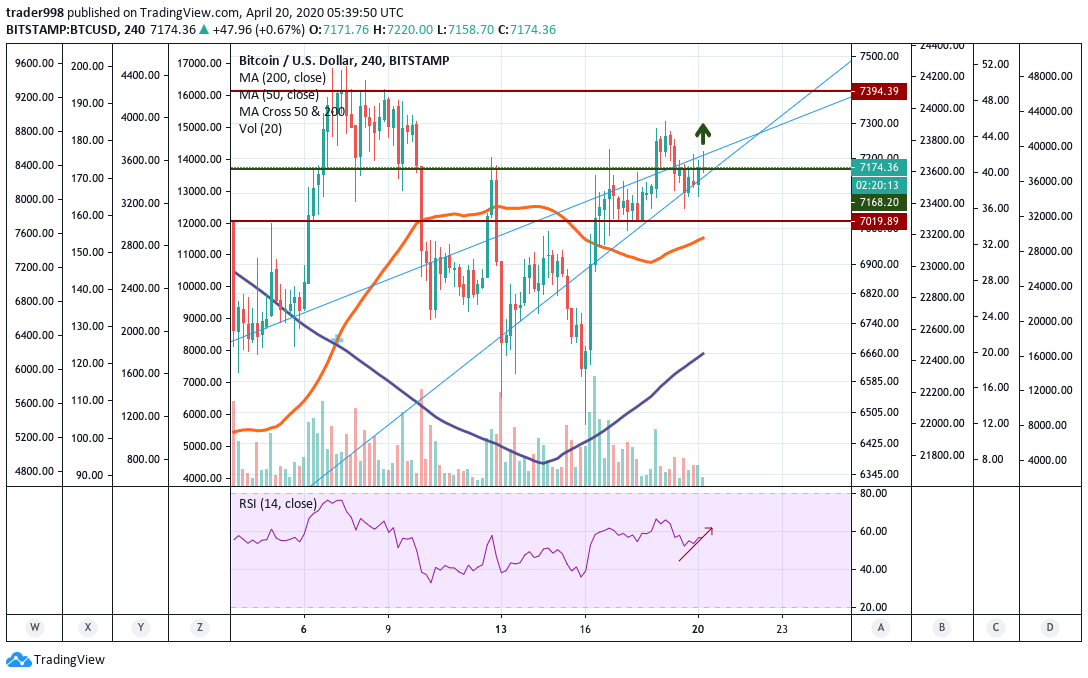
Here’s the four-hour chart for BTCUSD.
- BTC is currently in an uptrend, forming higher highs and higher lows. It has a formidable support zone at $7019.89.
- The previous resistance at $7,175 is currently acting as a makeshift support line. And since BTCUSD is likely to break above the current trend, it could potentially reach the $7.4 mark soon.
- The Relative Strength Index indicator is poised suitably for further upside.
- The Moving Average Convergence/ Divergence Indicator is also giving a ‘buy’ signal.
Bitcoin is likely to make a big move in May. Although the probability of a massive upside is more likely, one cannot ignore the possibility of a significant decline of the BTCUSD.
BTCUSD Chart Published on TradingView.com
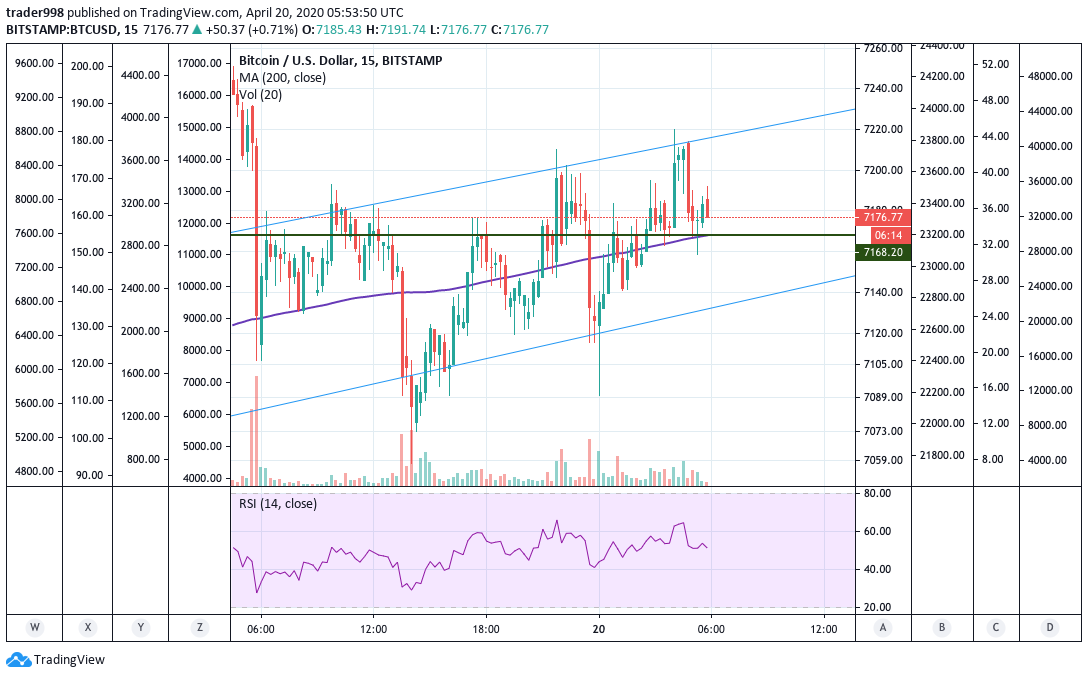
In the shorter-term, Bitcoin seems to be moving in a channel. Here’s the fifteen-minute chart for BTCUSD.
The 200 Simple Moving Average line in the fifteen-minute chart is acting as a support to the BTC prices. It will be interesting to see where the prices break out of this channel.


