

The price of Bitcoin Cash (1) rises above a falling wedge formation.
The IOMAP on-chain model predicts that resistance will decrease as BCH progresses toward recovery. The Bitcoin Cash uptrend will be confirmed if a daily candlestick closes above the 100-day EMA; a trend reversal is likely.
The price of Bitcoin Cash is leading a breakout, supported by a broadly positive cryptocurrency market. Following a Friday movement of 4.80%, the largest cryptocurrency, Bitcoin (BTC), surpassed $21,200. Green dominates the cryptocurrency market, with Ethereum now priced at $1,664. BCH anticipates extending its bullish wave to $158 but must first get above $125 of resistance from buyers.
Price of Bitcoin Cash soars out of a collapsing wedge.
After steep drops that ended with the price of Bitcoin Cash finding support around $95.00 in June, a recovery followed, driving up the price in late July. Unfavorable global economic conditions reduced purchasing pressure, which resulted in a widespread pullback across the cryptocurrency market, and BCH was not exempt.
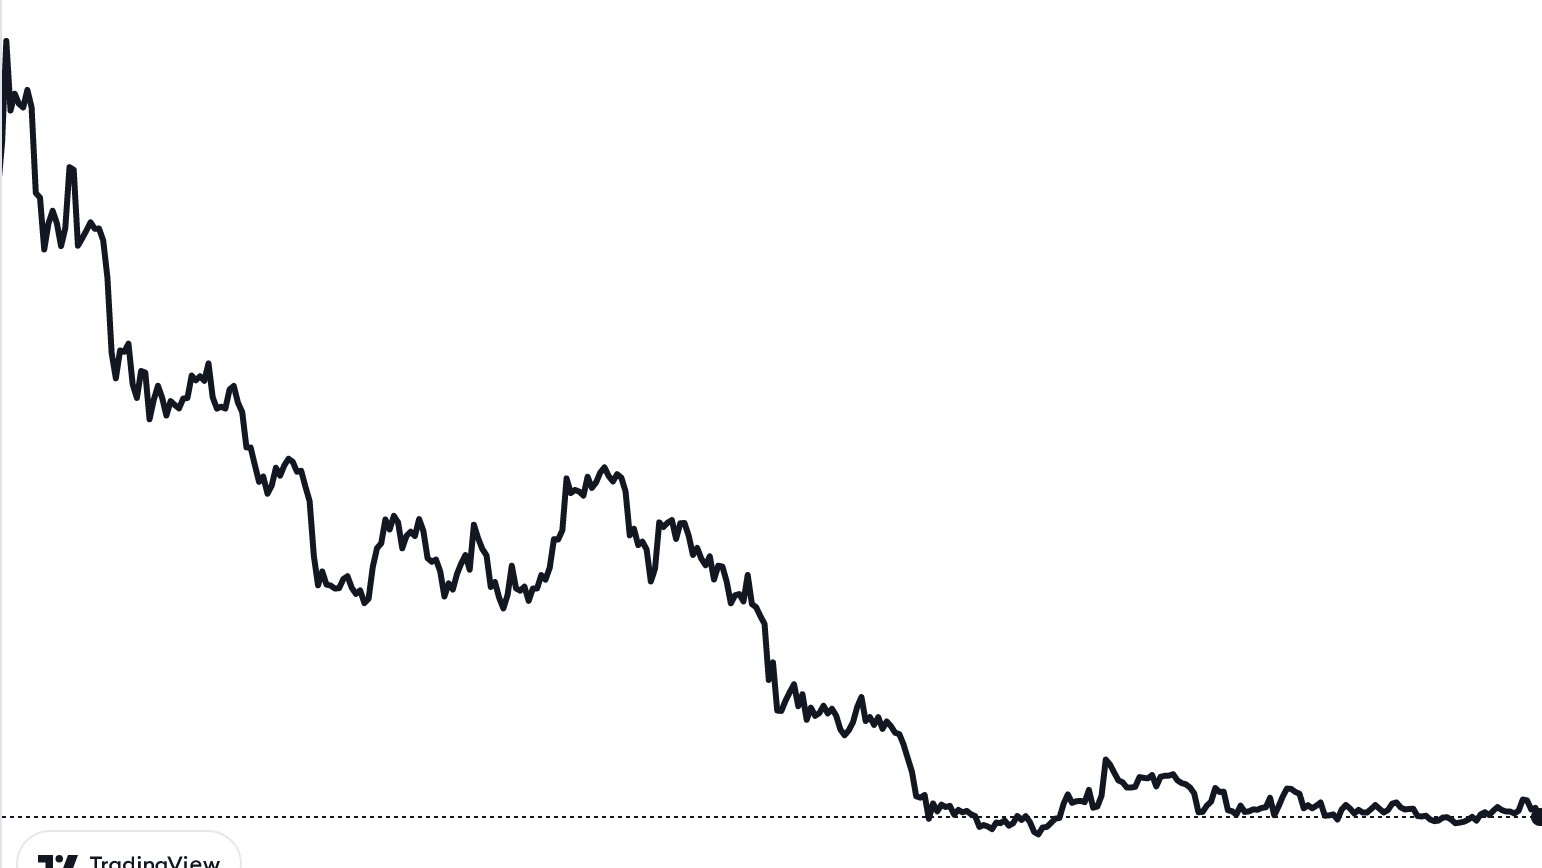
The daily chart below shows how a persistent decline has stifled the bulls' several attempts to reverse the trend. A falling wedge pattern might signal the conclusion of Bitcoin Cash's problems. When the price of an asset declines between trendlines that serve as support and resistance, a falling wedge pattern is formed. The very bullish pattern frequently denotes the conclusion of a protracted slump or the continuation of an upswing.
To verify a bullish breakout, though, more than just the presence of this pattern is required. As shown with Bitcoin Cash, traders must hold off on opening long positions until the price crosses above the top trend line. As BCH ascends the ladder above the wedge formation, a 38.51% advance to $164 has been hinted to. This profit goal is extended above the breakout point at $114 and is equivalent to the distance between the pattern's widest points.
Is there hope ?
After lately displaying significant positive signals, the Moving Average Convergence Divergence (MACD) and the Directional Movement Index (DMI) indicators support the optimistic forecast for the price of Bitcoin Cash. The price of Bitcoin Cash is well supported, as seen by IntoTheBlock's IOMAP model. According to the graph below, between $114 and $117, over 441,000 addresses bought 139,400 BCH.
A brief trend reversal won't be harmful as long as investors in that range continue to support Bitcoin Cash's potential rise to $164. Additionally, the same model shows that resistance is waning, which might support the upswing even more.
However, vigilance must be used to prevent jarring pullbacks. A daily candlestick close above the 100-day EMA will significantly increase the bulls' ability to influence the market. If the price fails to end the day above the moving average, on the other hand, BCH will yield to upward pressure. The 50-day EMA (in red) may serve as a possible profit target for short-term selling orders, which might be beneficial.


