

Bitcoin ended its gaining streak beginning on Thursday and continued with the drop further on Friday. It was initially forming a rising wedge, a Bearish pattern, and it soon started dropping after falling out of the wedge.
- The day’s range for the BTCUSD has been $6,822.91 — $7,314.93.
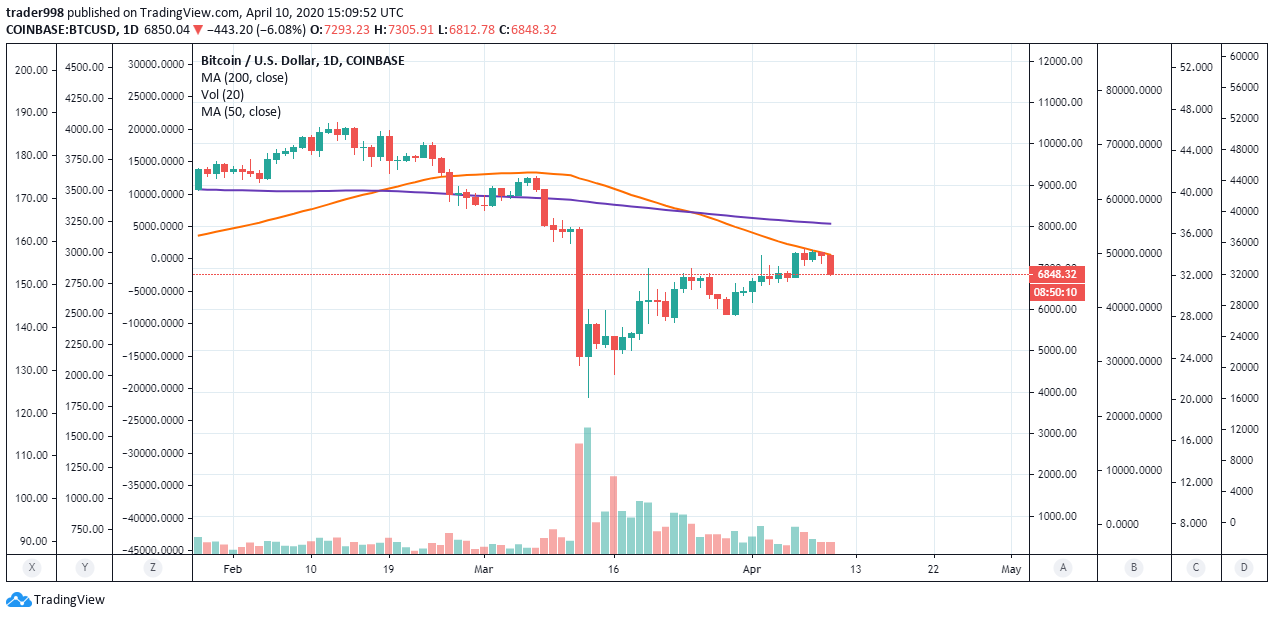
Chart by TradingView
Bitcoin has already dropped by almost 6% today. Many investors had jumped into the fake Bull trap earlier in the week when BTCUSD had started rising with the US Equity markets.
Bitcoin likely to drop further
- Although Bitcoin has dropped almost 10% in the last two days, it might not have bottomed out yet.
- Falling Bitcoin prices amounts to Bitcoin miners being less profitable, which translates to miners moving out of the network. The halving of rewards is likely to take place in a month, and with that, more Bitcoin miners will move out, leading to lesser security in the network. A compromised system would likely be prone to attackers.
- The daily chart, as well as the four-hour chart, indicate that the traded volume has been very low. This is another Bearish signal.
Here’s what the Technical indicators of Bitcoin point to:
- Key resistances are at $6,904.97, $7175.96, $7,413.00.
- Support lies at $6,645.45, $6,094.45 and $5,997.41.
- The Relative Strength Index and the Stochastic indicator point to a ‘neutral‘ signal, whereas the MACD gives a ‘sell‘ signal for the Bitcoin.
If the Bitcoin drops even further and the RSI enters the oversold territory, a potential ‘long’ trade could exist in that region. However, it all depends on Bitcoin’s movement from hereon.


