

Bias for ZCASH (ZEC)– Bullish
Resistance Levels- 140, $160, $180
Support Levels- $80, $60, $40
ZEC is in a bullish trend on the long-term outlook. The cryptocurrency price has been on upward movement after the failure of bearish marubozu candle formed on 11th October. The bulls’ gradual return was confirmed by the bullish spinning top on 12th October. Increased bullish momentum led to ZECUSD at $129.61 in the resistance area on 15th October.
The bullish exhaustion denoted by wicks returned the bears briefly as the candle closes at $114.66. The bulls’ strong comeback broke the downward trendline on 17th October with ZECUSD up at $124.85.
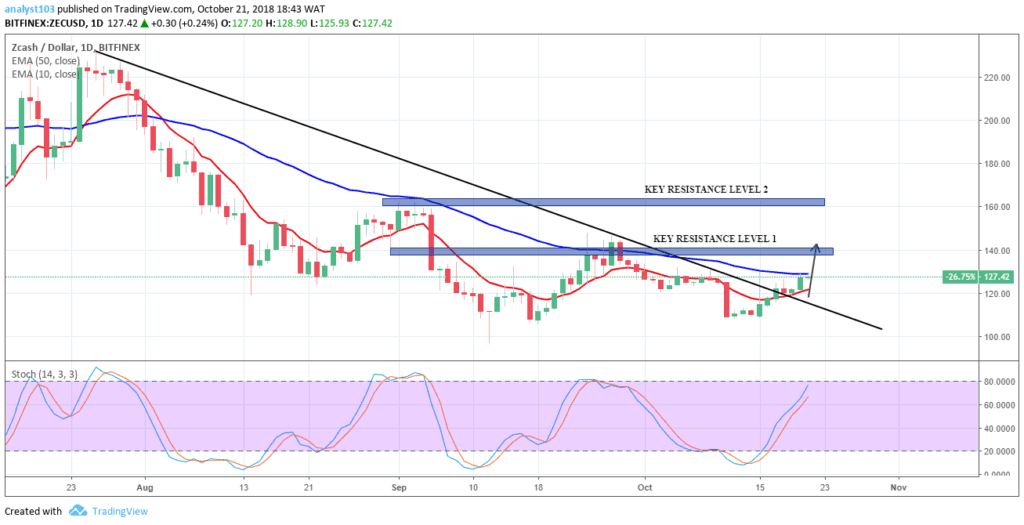
A retest of the broken line occurred on 19th October when the cryptocurrency was down to $118.29 in the support area.
The bulls return after the retest saw ZECUSD back up at $128.80 in the resistance area on 20th October
ZEC Price is above the 10 EMA with a bullish engulfing candle couple with the stochastic oscillator at 68 and its signal pointing up. These imply upward price movement.
Moreover, ZECUSD shows a falling wedge pattern. This further confirm the bulls full takeover of the market. $140.00 in the resistance area is the bulls’ initial target. A break and close of candles above this will pave the way for ZECUSD to retest $160.00 in the resistance area in the long-term


