

Technical Indicators:
Support Level: $0.3000
Resistance Level: $0.3100
Key Points:
- Ripple price recently broke downwards following bitcoin and ethereum.
- XRP tested the support around $0.2920 and later corrected upwards above $0.30000 resistance.
- Ripple’s upward momentum was also able to break through the bearish pattern which was being formed with resistance around $0.3010 on the hourly chart.
- Ripple price gained force and quickly moved over $0.3020 resistance level.
Ripple Price Analysis:
Summary: Ripple price recently crashed to a weekly low of $0.2913 and later corrected upwards. XRP was able to gain bullish momentum above $0.3000.
Ripple price declined sharply yesterday below $0.3000 support level. XRP tested the $0.2920 support level before starting to correct upwards. Buyers were able to push the price upwards over $0.3000.
The buying pressure increased bullish momentum and the price soon moved over $0.3020 resistance level. Also, the bearish pattern line which was being formed on the hourly chart was also broken. Currently, XRP is in a bullish momentum trying to move upwards.
There might be a downward correction, however, Ripple price might test the next resistance soon and if it is able to break through the $0.3060 and $0.3080 resistance level, it will move into a bullish zone.
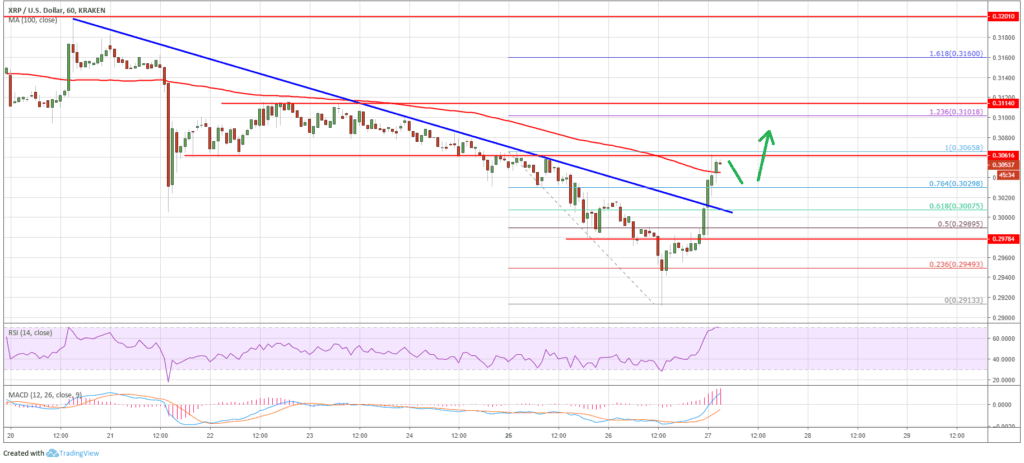
The chart shows that XRP was able to correct upwards after falling up to $0.2913. Ripple gained bullish momentum after moving over $0.3000 level. However, the buyers really need to break through $0.3060, $0.3080 and $0.3100 resistance levels in order to turn the overall momentum bullish.


