

Technical Indicators:
Support Level: $0.3000
Resistance Levels: $0.3050, $0.3100
Key Points:
- Ripple price fell down to $0.2918 recently before starting to recover.
- XRP gained force and was able to break above $0.3000 resistance level.
- Ripple price was also able to break through the bearish pattern which was being formed yesterday on the hourly chart with resistance around $0.2980.
- Currently, XRP is facing a major resistance around $0.3050.
Ripple Price Analysis:
SUMMARY: Ripple price recovered quickly and nicely before falling up to $0.2918 recently. XRP was able to break above $0.3000 resistance level and might soon test $0.3100 level.
There was a high risk of a crash in XRP price yesterday as Ripple price settled well below the $0.3000 support level and the 100 hourly SMA. The massive selling pressure even pushed the price below $0.2950 support level up to $0.2918. However, the price was soon pushed by the bulls which followed the price movements of bitcoin and ethereum which showed massive increases yesterday with ETH rising more than 10% in the last 24 hours and BTC break through the $5850 resistance level.
The buyers were able to push XRP price above the bearish pattern which was being formed on the hourly chart yesterday with resistance around $0.2980. Ripple price was able to break and settle above $0.3000 resistance level and the 100 hourly SMA which turned the momentum bullish. XRP tested the $0.3050 level where strong resistance is formed and pushed the price a few points downwards.
A bearish pattern is still being formed on the hourly chart with resistance around $0.3050 which might push the price back downwards below $0.3000 level. However, if XRP is able to break through this range, it might soon test $0.3100 and $0.3125 levels.
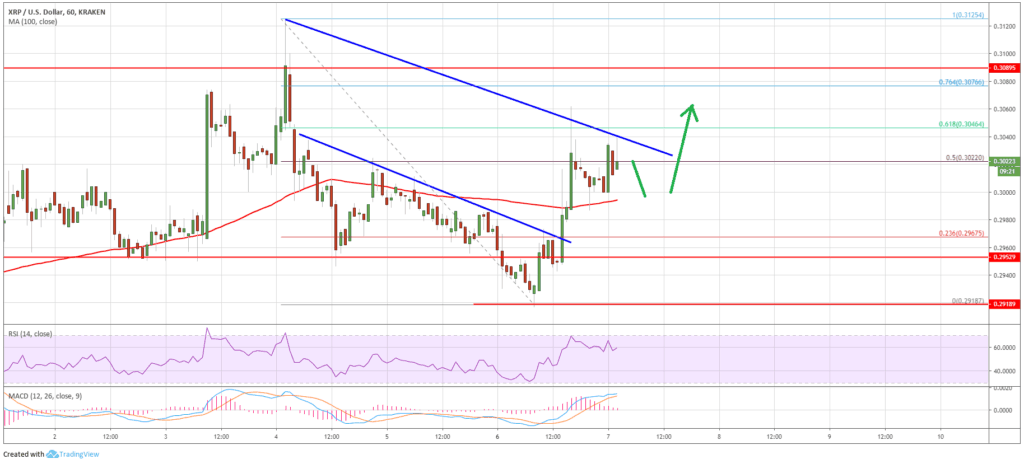
The chart shows that Ripple price is currently trading in a positive zone after recovering back above $0.3000 resistance level. This level has now turned into strong support where a lot of buyers are placed. If however, XRP falls below this level, the overall momentum shall turn bearish again.


