

Dominant bias for STELLAR (XLM)- Bearish
Resistance Levels- $0.2550, $0.2600, $0.2700
Support Levels- $0.2150, $0.2100, $0.2050
XLM is in a bearish trend. After breaking down at the 34 exponential moving averages on 24th October, the bearish pressure has been on a nice roller coaster to the south forming lower lows. $0.2410 was the low on 24th October while 25th October low was $0.2387. This is characteristics of a down trending market that produces lower highs and lower lows. The 4-hour opening candle at $0.2388 was a bearish marubozu which signals bears presence and pressure.
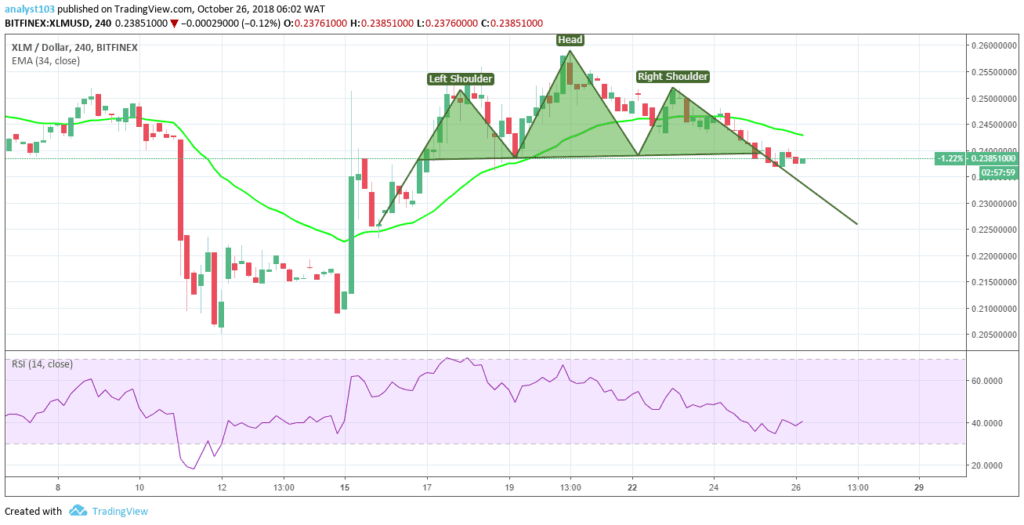
With XLM price below the 34 EMA and the relative strength index at 39% which is the sellers’ zone, these suggest downward movement in the cryptocurrency due to the Bears’ pressure.
Moreover, the inverted head and shoulder pattern plays out well with the right shoulder developing. The bears may be aiming at a retest of $0.2255 in the support area.


