

Bitcoin and fellow altcoins started the month with a stable market trend as the trading prices were always in accordance with the 20-day and 50-day moving averages. The trading volumes were also quite stable as the level of fluctuations were pretty stable in the charts.
Things, however, changed this week as a drop in the trading volume caused fluctuations in the charts which was accompanied by a sudden drop in the prices of Bitcoin and altcoins that the bulls couldn’t support the price.
Bakkt launched their Bitcoin futures service which turned out to be a failure as the level of trading on the platform was very low as compared to what they expected. Many crypto enthusiasts and analysts have considered this launch as one of the reasons behind the massive drop in the Bitcoin price.
Bitcoins market dominance have increased over time, and this sudden drop in the price caused chaos in the crypto market, and its effect was seen on the altcoins as well.
Bitcoin dropped from $10,000 to $8,300 as the price faced a downward correction on 24th September. This drop was the biggest that the crypto community had experienced in the past few months, and it affected the trade as well as the altcoins.
On 25th September, bulls tried to correct the price and push it towards the resistance levels of $8,800, but the market was dominated by bears at that time. Another downward correction took place that took the price to test the support levels of $8,000 in the next 2 days.
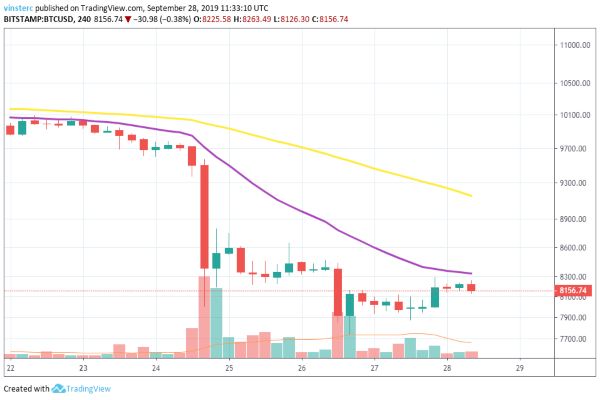
26th September noticed a further break in the price as the bears took the price to test the support levels of $7,800 while aiming for the key support of $7,500. This trend continued till 27th September as the price tried to pass through the resistance level of $8,000.
Currently, Bitcoin is trading at $8,156.74 with strong resistance forming near the $8,300 level. Immediate support is present near $8,000 and $7,800 as the price continues to trade near the $8,000. A further decline can be expected, which will take the price to test the support levels of $7,500.
ETH/USD
The trend change in Bitcoin was witnessed by Ethereum as well as it went down. Ethereum traded at $224 in the previous week, and a slow decline started in the charts as the altcoin entered this week.
The slow decline took a major turn by the end of 24th September when the price witnessed a major drop. On 25th September, people woke up to an all-time low as the price came crashing to $165.
This drop continued till 26th September as the price further declined to test the support levels of $158. At such low levels, the bulls saw an opportunity and decided to give ETH a slight push as the price moved upwards and went upwards towards the $175 resistance levels.
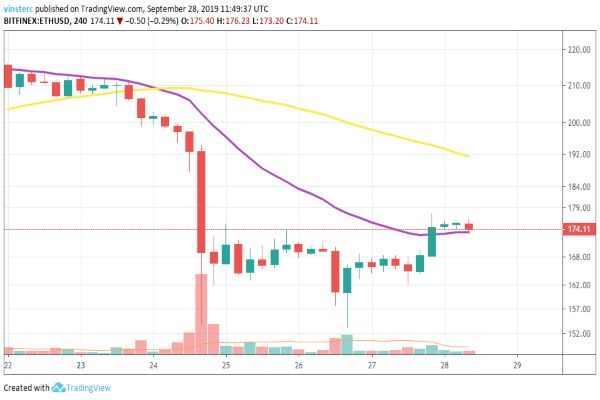
Currently, ETH is trading at $174.11 as strong resistance can be seen near $177, and immediate support is forming near $168 and $166 as the price struggles to go beyond the resistance level. A downward correction might take the price to test the $168-$164 support levels again.
XRP/USD
Ripple witnessed a slow downward correction in the price as the charts formed a slope heading towards the support levels. Trading at $0.2906 on 22nd September, XRP declined towards $0.2337 by 24th September as the major drop in Bitcoin took place.
Since then, XRP has been trying to maintain a bullish trend as the price struggles to reach towards the resistance levels of $0.2500. An upward trend was seen forming on 26th September, but the chart again witnessed a bearish dominance as the price started correcting again.
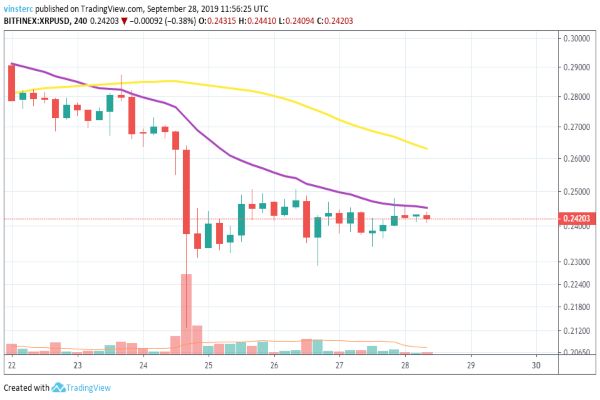
Currently, XRP is trading at $0.2420 as the price struggles to head towards the resistance level of $0.2500. Immediate support can be seen, forming near the $0.2380 and any further drop in the price might take the price to test the support levels of $0.2350 and $0.2250.
LTC/USD
Litecoin proved its position in the market as the price noticed some major bullish trends by the resistance levels of $78 and $76 in the past week. LTC started this week by trading at $73 level as the price continued to have a stable trade at this level till 24th September.
On 24th September, the bearish trend entered the charts, and the pressure was so strong that they took the price down by 26th September and it was trading at $53.28 as the price continued a decline to test the support level present at $50.
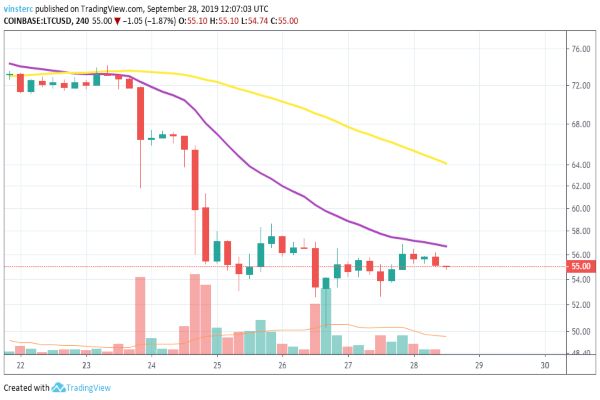
A slight correction was seen in the charts, but the bears have been dominating the market, and the price couldn’t go past the $58 resistance level. Currently, LTC is trading at $55 with a strong resistance forming near the $57 level, and immediate support is present near $53 and further at $50.
BCH/USD
After testing the major resistance of $330 last week, Bitcoin Cash also got affected by the Bitcoin downfall as the price declined from 24th September onwards. The decline was initially slow, but major changes took place as the price dropped by double digits and went from $292.56 to $221.03 and further continued the trend.
On 25th September, BCH was trading at $221.03 with the signs of a further downward correction in the charts. A slight bullish push was witnessed in the charts, but the price again declined on 26th September as it tested the support levels of $206.
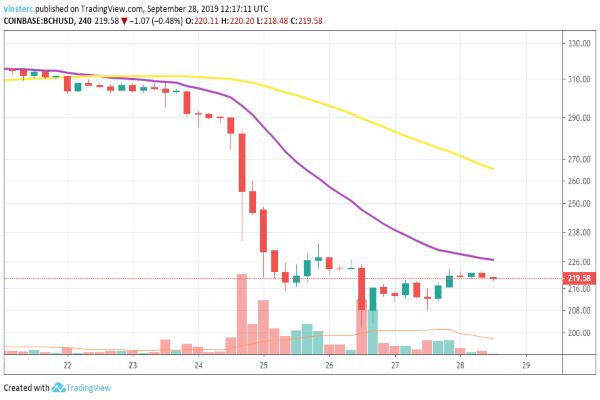
Bitcoin Cash is currently trading at $219.58 as it witnesses slight correction in the charts. Strong resistance can be seen at $222 level, and immediate support is forming near $216 levels. A further decline can take the price to test the support level of $210 again.


