

Technical Indicators
Significant Support Level – $0.2850
Significant Resistance Level – $0.2940
- Ripple price fell down further and broke the major support levels around $0.2940 and $0.2900.
- There is a bearish pattern line formed with resistance around $0.2960 on the hourly chart.
- XRP is trading a bearish zone and it is at risk of falling towards $0.2820 or $0.2800.
Ripple price fell down sharply against the US Dollar as well as Bitcoin. XRP/USD settled beneath $0.2940 and a lot of sellers are now placed on the upside.
Ripple Price Analysis
Ripple price fell further and breaking the numerous support levels around $0.2900. Selling pressure easily broke the $0.2940 support and the 100 hourly SMA. Ripple price declined underneath the $0.2900 support level. It fell down to a monthly low of $0.2867 and it appears that sellers are in full pace. Right now, XRP is trying to correct losses above $0.2870 but there are no bullish signs.
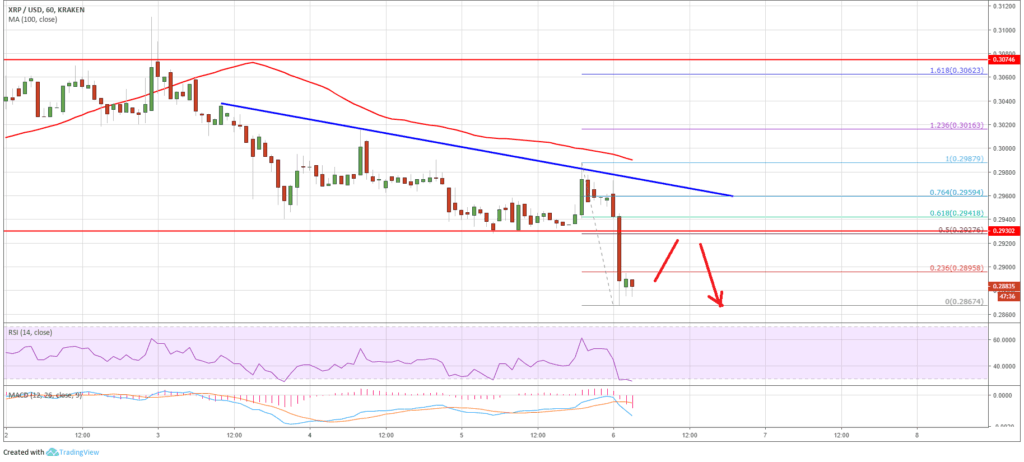
The resistance levels are close to the $0.2920 and $0.2940. The previous support level was around $0.2940, which is probably going to stop the price from moving upwards. There is a key bearish pattern line formed with resistance around $0.2960 on the hourly chart. On the upside, Ripple price is going to confront sellers around $0.2920, $0.2930 and $0.2940.
Taking a look at the chart, XRP moved into a bearish zone beneath $0.2960. If the selling pressure remains strong, there is a risk of a decline under the $0.2800 support level.


