

Technical Indicators
Support Level – $0.2850
Resistance Level – $0.2920
- Ripple price started to recover, however, it was unable the resistance around $0.2900 and $0.2920.
- Yesterday’s key bearish pattern line is still placed with resistance around $0.2890 on the hourly chart.
- XRP must break the $0.2900 and $0.2920 resistance levels to begin a recovery.
Ripple price is in a bearish trend against the US Dollar as well as Bitcoin. XRP might keep moving downwards and even break the support around $0.2850.
Ripple Price Analysis
After falling to $0.2850, Ripple price began to recover. XRP was able to move above the $0.2860 and $0.2880 resistance levels. However, the resistance around $0.2910 and $0.2920 proved quite strong and XRP was not able to move above this range. Ripple price gradually started falling lower and settled beneath $0.2900 plus the 100 hourly SMA.
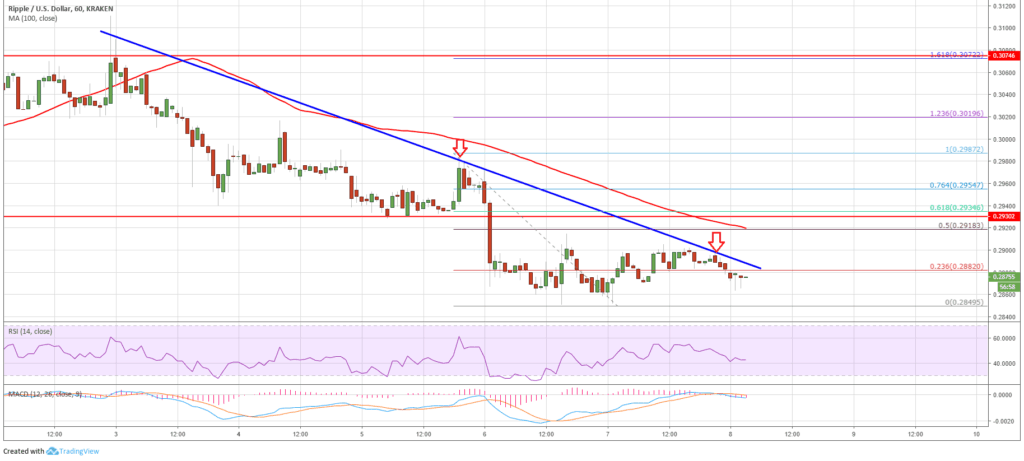
There are a good number of sellers placed around the $0.2900 and $0.2920 levels. Yesterday’s bearish pattern line is still placed with resistance around $0.2890 on the hourly chart. XRP is probably going to face a huge selling pressure around $0.2900 and $0.2920 resistance levels. The first support for XRP lies around $0.2850, underneath which there is a danger of the price dropping to $0.2800.
Taking a look at the chart, Ripple price is set in a bearish zone beneath $0.2920. If Ripple is unable to move above $0.2930, selling pressure will keep on increasing. This selling pressure could soon drive the price underneath $0.2850 and $0.2820 in the short term.


