

Bitcoin currently seems to have lost its fanfare among investors as its journey appears to have hit a rough patch. Investors are turning towards other major cryptocurrencies in the market. In the trading universe, diversification always plays a significant role.
Let’s delve into the analysis of some of the trending cryptocurrencies:
Price Analysis of Ethereum (ETHUSD)
Ethereum tops our list of the alternatives to Bitcoin, simply because of its high traded volume, which proves its popularity among investors.
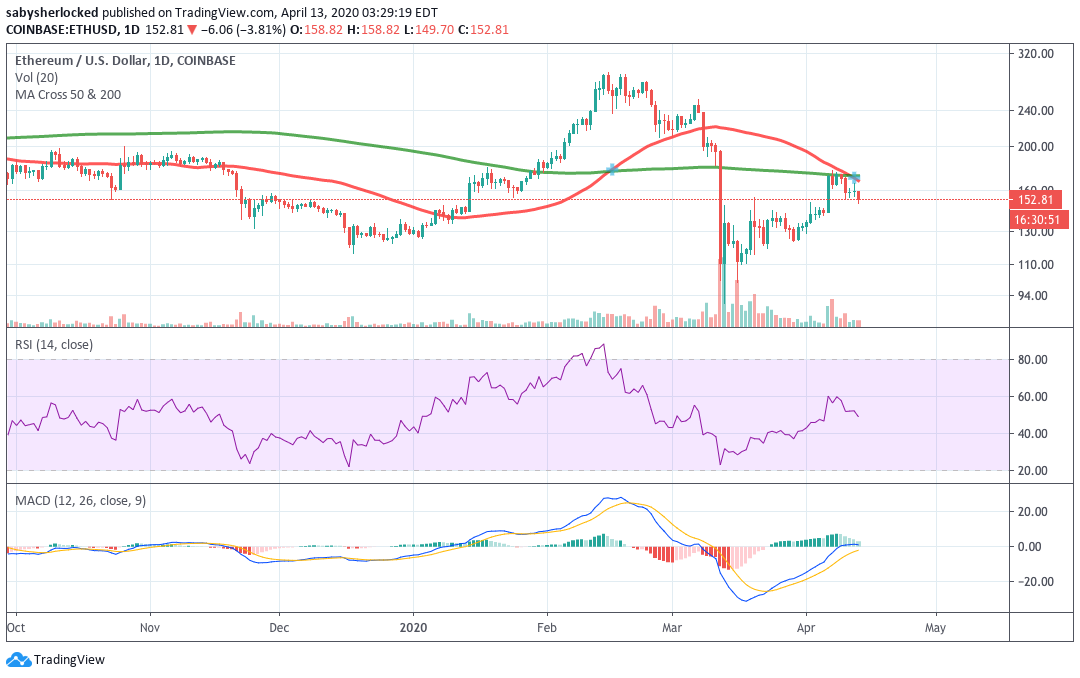
- Day’s range for Ethereum has been between $150.12 — $158.82.
- Ethereum formed a Death Cross, which is a strong Bearish indicator, on April 12 on the Daily chart. A large red candle followed the Death Cross, thereby confirming that the price movement followed the pattern.
- The four-hour chart shows the presence of support by the 200 Moving Average (MA) at $143.10. The hourly chart shows consolidation around the $153 zone.
- The Relative Strength Index (RSI) shows that ETHUSD could soon enter an oversold territory, following which there would exist the opportunity of entering a Long position. Investors could wait until the price drops to around $143 before entering the trade.
Price Analysis of Litecoin (LTCUSD)
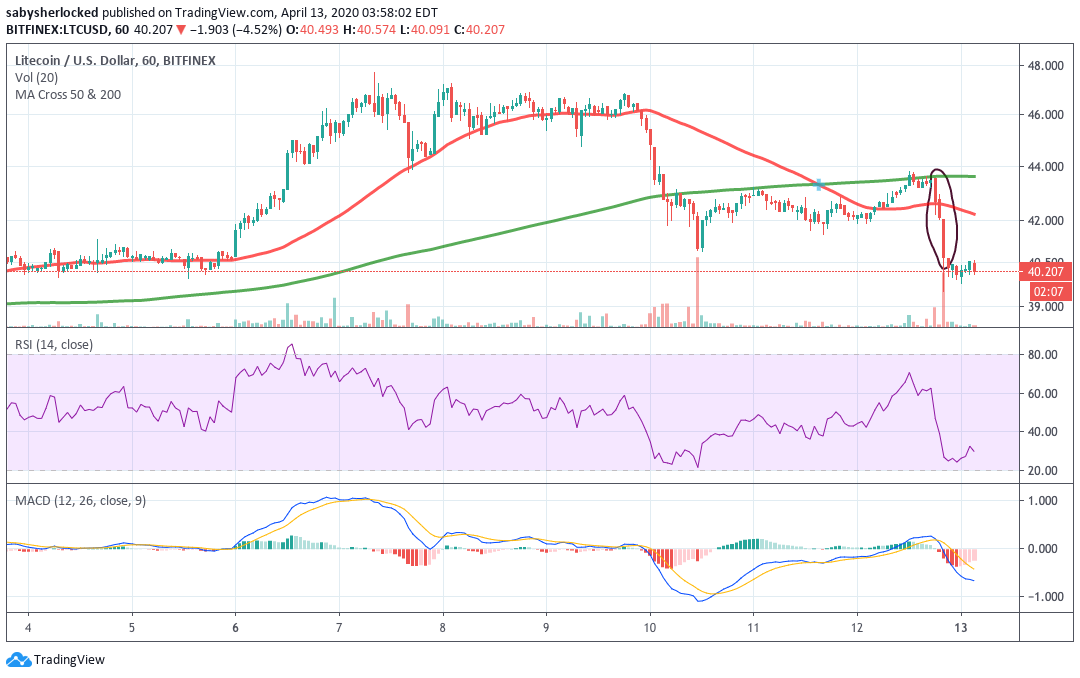
- The Hourly chart shows the formation of a strong Bearish pattern called the three black crows. It is a Bearish reversal pattern that comes at the end of a Bullish trend. The price dropped rapidly following the pattern.
- The RSI and the MACD indicators point to a further decline for Litecoin. Downward crossover of the MACD line likely to happen soon. It might be a chance to enter a Short position; however, it might be a risky trade.
Price Analysis of Ripple (XRPUSD)
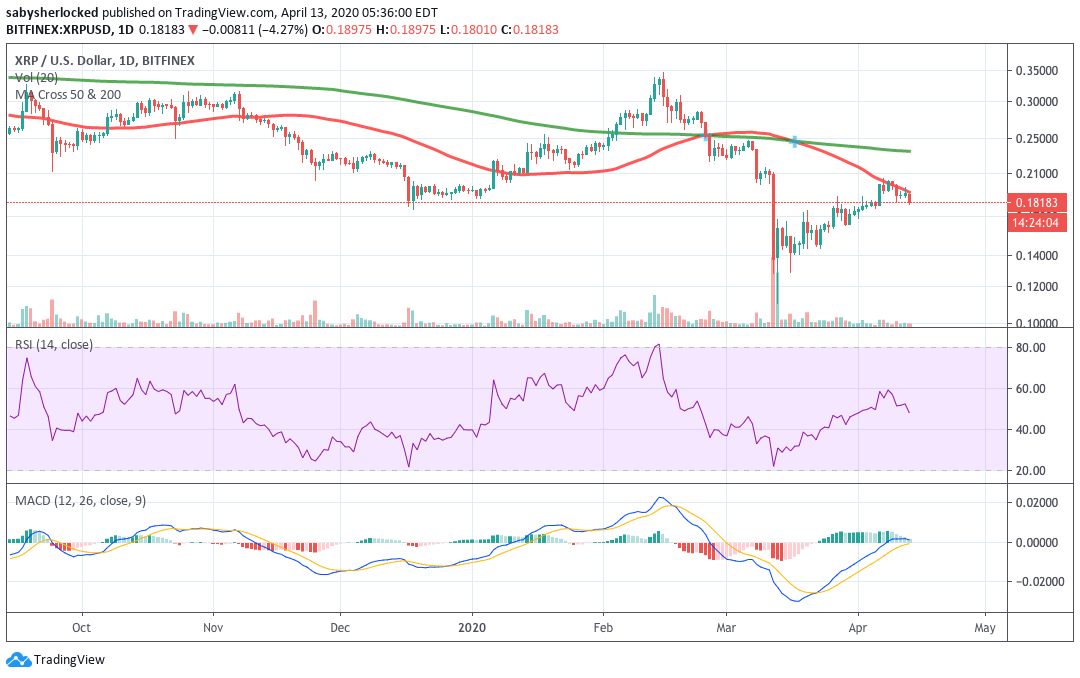
- The daily chart seems to be forming a Bear flag. In that case, the price might drop further.
- The low volume indicates that it is clearly not a Bull market, and a price drop is confirmed.
- However, the hourly chart indicates that once the RSI line touches 20 of the 20,80 RSI, there would exist the possibility of a Buy signal, considering the support at the $0.137 zone.


