

Bitcoin is having a hard time finding the right bullish push in the market, and because of that, it is facing a downward correction with every passing day. Bitcoin is testing the supports levels as well as the patience of every investor who is losing money with every passing minute.
In the last two days, we have seen Bitcoin touching the $10,500 resistance and then taking the decline path. There was a close above the $10,000 support level, but the bulls couldn’t hold that position for a long time.
Bitcoin is set on a downward correction path, and it has declined further from yesterday’s price of $10,126.41. Currently, Bitcoin is trading at $9,446.94, and this downward correction has done a lot of damage in the trades. The immediate support level is forming at $9,200 level.
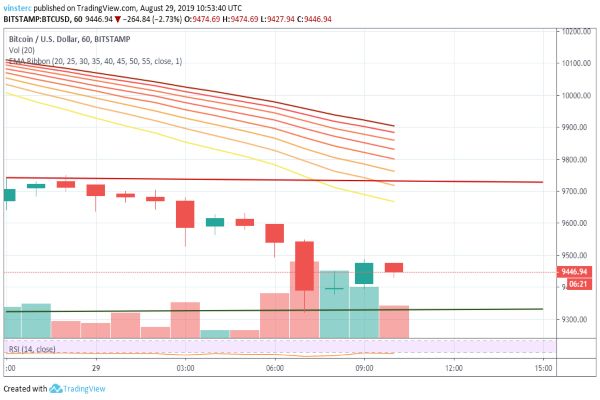
The major support level of $9,500 has turned into the resistance level now, and Bitcoin is struggling hard to get past this level. The RSI has declined down to 29.08%. This price is perfect for the bulls to provide the push and this can lead Bitcoin price back in $10,000 level otherwise any further decline from here will take the market to $9,000 and even below that to $8,500.
ETH/USD
With the drop in the price of Bitcoin today, Ethereum faced a downward correction to and broke all the support levels that were predicted to hold it.
Ethereum lost the stability in its price today, and currently, it is trading at $170.05 with immediate support forming at $168. Strong resistance can be seen around the level of $172-$174. The main resistance is forming near the $180 and $182 levels.
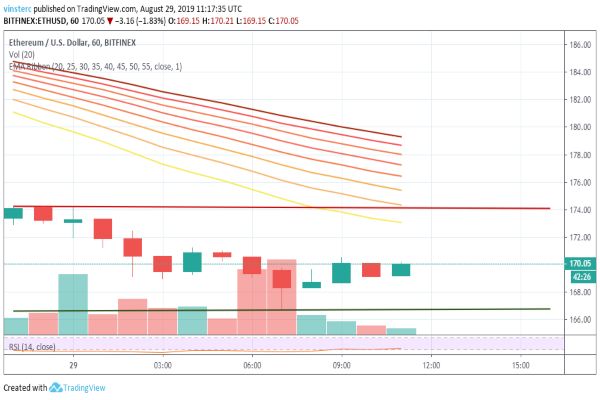
However, if we look at the chart, Ethereum price is facing a strong resistance near the $172 and $175 levels, and if the decline continues, then it can test the support levels of $168 and $164.
XRP/USD
The downward trend can be seen in all the cryptocurrencies in the market. Every currency is testing the major support levels that are available for them, and XRP did the same thing today.
Ripple saw another downward trend in its chart, and the price further declined. XRP is currently trading at $0.2531 against the U.S. Dollar. The support levels of $0.2650 and $0.2550 were tested by XRP and now its facing resistance at $0.2535.
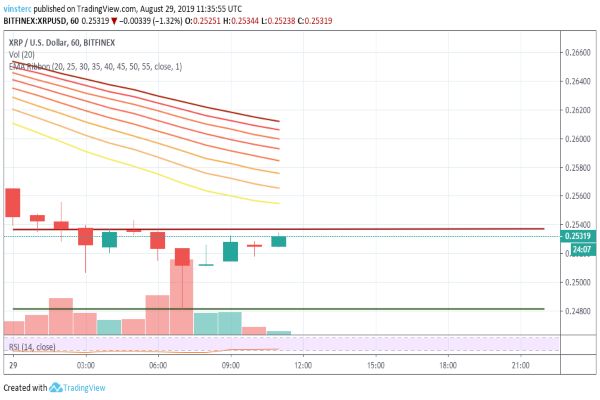
Major resistance can be seen around $0.2565 levels, and in case there is no upward trend formed in the market, we can expect the price to test the support levels of $0.2480 and $0.2450.
LTC/USD
Litecoin became the part of the downward correction trend as well when its price declined from $71.89 from yesterday. Currently, LTC is trading at $65.14, and the chart suggests that a further dip in the price can be expected from LTC.
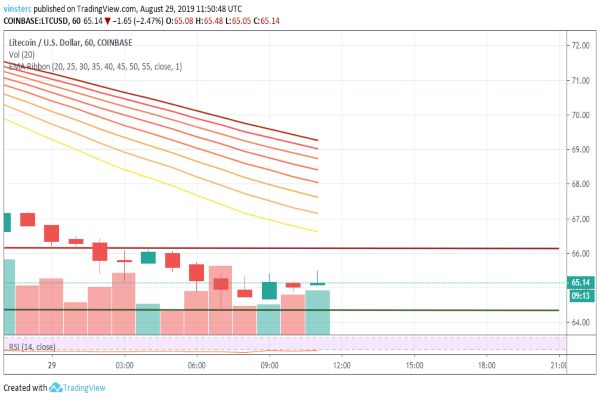
Strong resistance can be seen around $66.50 as it Litecoin struggles to break the resistance and aim for the major resistance forming at $71 and $75 level. Immediate support can be seen forming near the $64, and if the decline continues, then, it can test the support levels of $62-$60.
BCH/USD
BCH has been resting on the edge of the price chart with a sudden rise and sudden falls in the price. Currently, it is facing a trend of a downward correction, and the price saw a huge decline in the chart today.
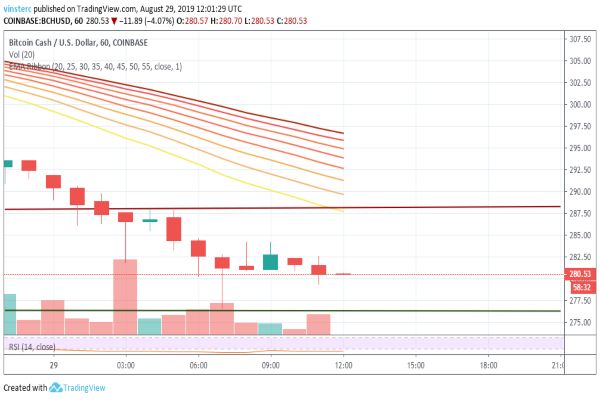
Currently, BCH is trading at $280.53, which is a considerable decline in the price from yesterdays $306.87. The support levels are being tested at this point by every cryptocurrency. Strong resistance can be seen $290 level with immediate support available at $275. Major resistance is present at $305 with the next one at $325.
BNB/USD
Binance Coin is having a hard time keeping up with the market, and the decline in all the cryptocurrencies is hitting BNB hard. BNB is under immense pressure to gain back the price trend above as it has already fallen more than 12% in the past few days.
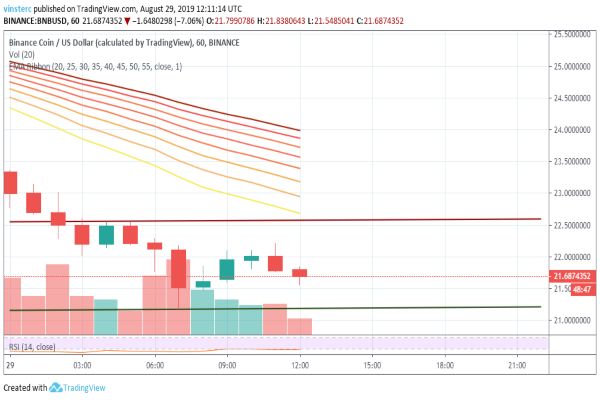
Currently, BNB is trading at $21.68 with immediate support level forming at $21.10, and a strong resistance can be seen at $22.40. Any further decline will take the chart down to test the support levels of $21.00 and $20.50.


