

Bitcoin started the week strong with a bullish trend seen in the charts and reached the trading price of $10,935, followed by a slight downward correction to reach $10,693. The resistance of $10,700 was again broken by Bitcoin yesterday, and it ended the day at $10,779.49.
However, today, we are seeing a huge downward correction in the Bitcoin price as it falls below the immediate support levels that were expected yesterday. Currently, Bitcoin is trading at $10,080.11, a price that has tested all the support levels and fell below the $10,200 support level as well.
This downward correction in the price has made the trade volumes increase below the $10,400 and $10,450 levels. The pair is trading below the 23.6% Fibonacci retracement level, and the support levels have gone down to $10,000 and $9,850 again. Bitcoin is facing strong resistance at the $10,250 and $10,200 levels, and it will be a crucial time for the bulls to step in and help with a push.
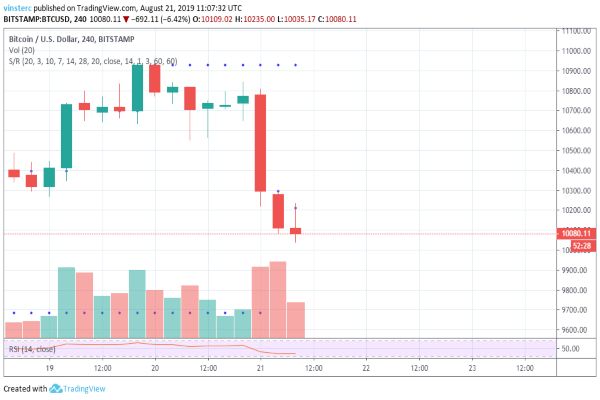
If the bullish trend is not achieved, Bitcoin can reach the immediate support level of $10,000 and further it can test the support levels of $9,800 and $9,700. The bearish trend in the chart is not looking good, and if Bitcoin fails to close the day above $10,000, then it can revisit the $9,500 low.
In the case of a bullish trend, we can expect the price to test the $10,400 and $10,500 resistance levels. If the price continues to fall, we can expect a strong bearish move around the range of $9,700 and $9,500.
ETH/USD
With the sharp decline in the prices of Bitcoin today, Ethereum faced a similar trend in the charts, and it went down from yesterday’s $197.20. Currently, Ether is trading at $188.46, which is near the $192 support level.
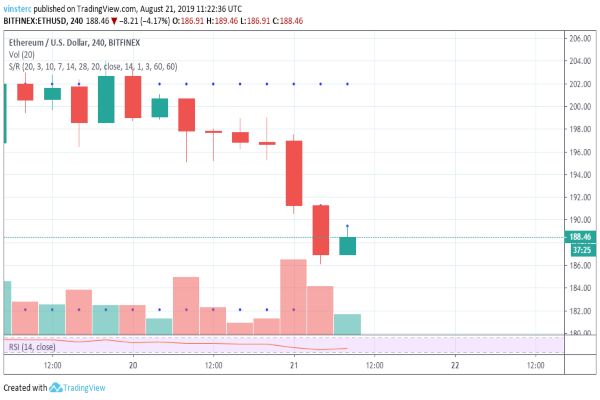
It further went below the $192 support level and tested the $188 support level. Strong resistance can be seen through the chart around $189 and $191 levels.
If the price breaks the resistance and goes above $191, we can expect the price to rise to $195 and $200 level. If the price struggles near the current resistance levels, we can expect a further downward correction in the coming time.
XRP/USD
XRP prices broke the resistance levels of $0.2850 recently, but it couldn’t break the $0.3000 resistance level. Instead, a downward correction has started since yesterday, and currently, XRP is trading at $0.2637 and going down.
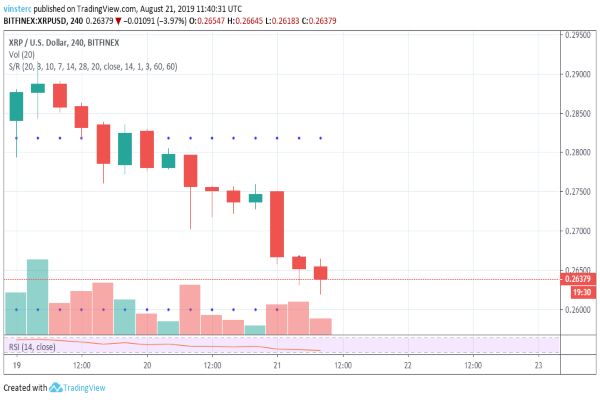
It recently broke the support level of $0.2700, and strong resistance is forming near the $0.2680 level in the chart. The support levels are set t $0.2620 and $0.2600, below this we can expect the XRP to test the $0.2590 and $2580 levels.
If the bulls fail to defend the $0.2630 price, then we can face more downward correction, and XRP can test the support levels of $0.2580.
LTC/USD
Litecoin is still facing some strong downward corrections, and it is currently trading at $72.12, which is near yesterday’s predicted support level. It is facing a strong resistance near $72.50 level.
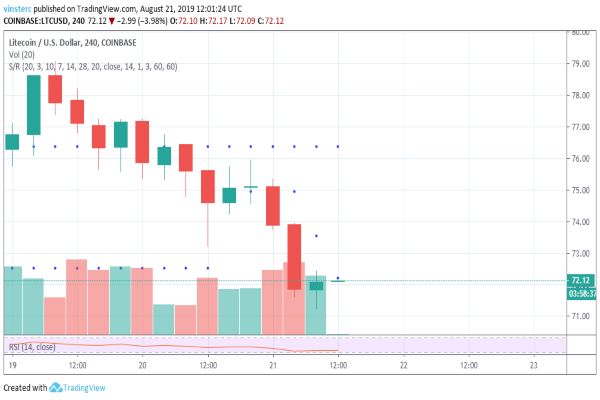
If the bearish trend continues, then, we can expect LTC to reach the next support level of $70, and it can further test the $68 support level. The chart suggests a downward trend for today as well, and if this continues, then we can expect Litecoin to hit this month’s lowest price soon.
BCH/USD
Bitcoin Cash captures the 4th largest market in the cryptocurrency world. From the past few days, we have seen a bullish trend in the price of Bitcoin Cash, but there was a drastic change yesterday in the price of BCH.
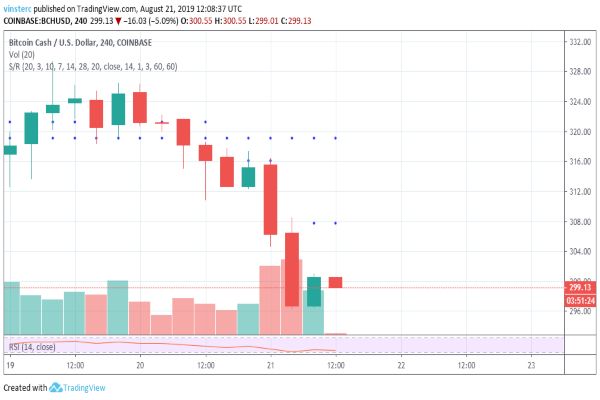
Currently, it is trading at $299.13, which is lower if we compare it with yesterday’s $317.15 mark. BCH was able to test the support levels of $312 and $300. Current trading price, according to the chart, shows a strong resistance faced at the $303 level and the immediate support available for BCH is at $295.
This downward correction can lead to a further decline in the price of BCH, and it might test the support levels at $290 and $285 in the coming days. However, if a bullish trend is achieved by today, then we can expect the next major resistance at $317 level.


