

As we enter the third week of this month, we see the price trends change for every cryptocurrency at a different pace. The first two weeks of September tested the support levels of every cryptocurrency as well as the power the bulls hold in the market.
Bitcoin fell face first as its price went down and traded almost as close to $10,000 level. The price continuously formed a wave-like trend as the price tested the support and resistance levels present in the charts. Similar scenarios were seen in the rest of the cryptocurrencies as well as the price kept fluctuating.
However, things have changed this week as the price for other cryptocurrencies witnessed an upward trend which helped them break through the resistance levels and moves towards the key resistances. Bitcoin is still facing a bearish dominance in the market as it struggles to trade above the resistance level of $10,300.
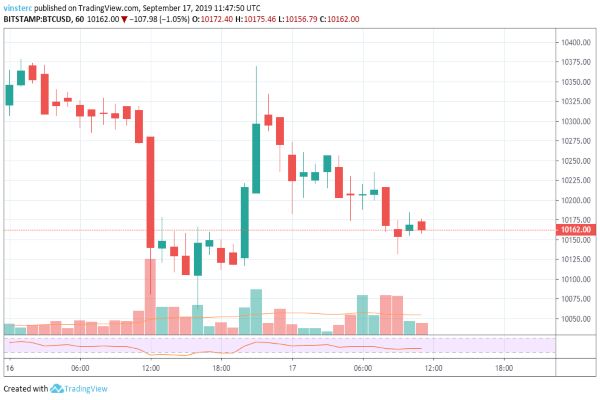
Currently, Bitcoin is trading at $10,162 as the price struggles to go past the resistance level of $10,300. An immediate support level is available at $10,100 as the price is trading in the lower zones. In case a bullish push comes, we can expect the price to go above $10,300 and $10,350 to focus on the resistance levels of $10,450 and $10,500.
If the downtrend continues or the bears can hold the price below $10,400, we can expect the price to test the support levels of $10,100, $10,000, and further down test the critical support level of $9,800.
ETH/USD
Bitcoin is ready to trade below $10,000 as the price continues to fall; on the other hand, Ethereum is moving towards the major resistance levels of $200.
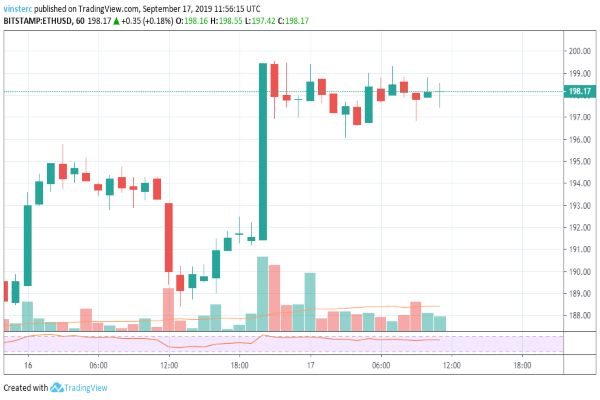
Currently, ETH is trading at $198.17 with immediate support forming at $196 as the price rallies towards the resistance levels of $200 and further. In case there is an entrance of a bearish trend in the market we can expect the price to correct downwards and test the support levels of $196 and further down to $193-$190.
If the bullish trend continues, we can expect the price to go further beyond the $200 levels and test the major resistance levels of $210. Beyond this resistance level, the price could surge towards $220 and above.
XRP/USD
Ripple is finally maintaining a steady upward trend towards the major resistance levels. The price is showing positive signs of growth as the price breaks the resistance levels of $0.2650 and moves upwards.
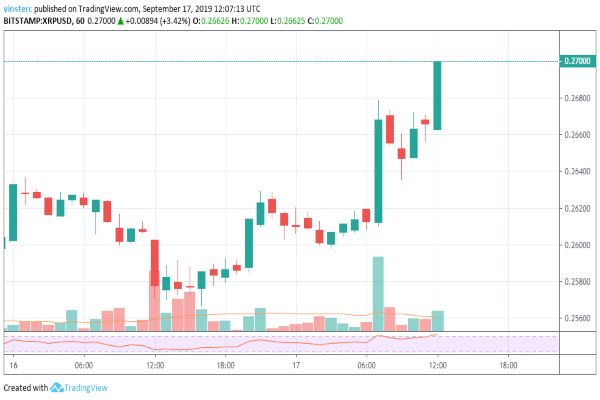
Currently, XRP is trading at $0.2700 as it moves further above. Immediate support is forming near the $0.2650 level as the price moves towards the key resistance level of $0.2750. If the bullish trend continues, we can expect the price to go above the $0.2780 level and rally towards $0.2820 and $0.2850 major resistances.
If a bearish trend enters the market, the bears will try to pull it down towards the $0.2580 and $0.2600 levels and any further decline will make it test the support levels of $0.2550.
LTC/USD
Litecoin is moving up and ahead as it leaves behind the resistance level os $70 and $72 and moves towards the resistance level of $75. This rise in the price was much needed for LTC to regain its market value.
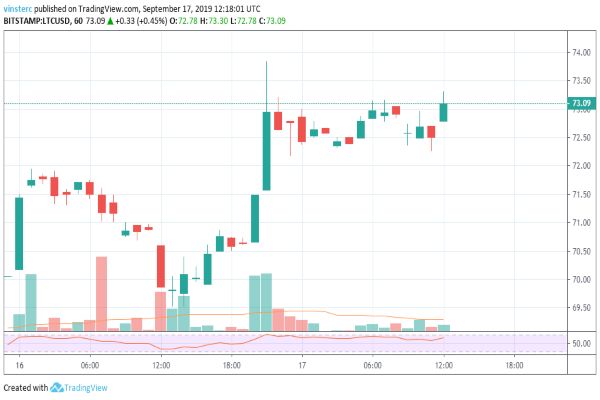
Currently, LTC is trading at $73.09 as the price moves towards the resistance level of $75. Immediate support can be seen, forming near the $72 level. In case the bullish trend continues, we can expect the price to move beyond the resistance levels of $75.
If LTC faces a downward correction, we can expect the price to go further down and test the support level of $72, and it can go further down and test the support levels of $70 and $69.
BCH/USD
Bitcoin Cash and forming a wave pattern as the price is testing the support levels and breaking the resistances with the sudden fluctuations in the price.
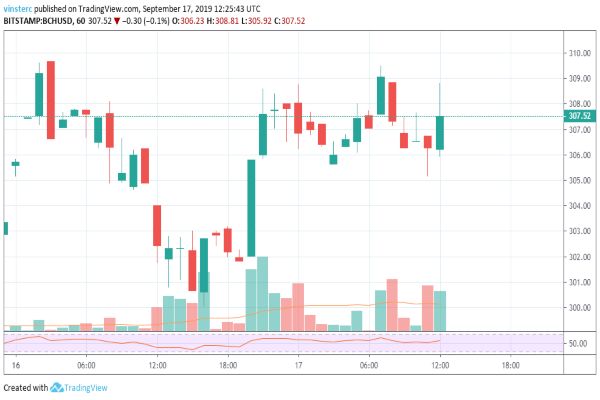
Currently, BCH is trading at $307.52 with a strong resistance forming near the $310 level. Immediate support can be seen, forming near $305 as the price fluctuates between $310 and $305. In case a bearish trend enters the charts, we can expect the price to test the support levels of $305, and if a further decline occurs, the price can test the support levels of $302 and $299.
However, if the bullish trend continues, we can expect the price to go beyond the resistance of $310 and aim for the $315 and $318 key resistance levels.


