

Cryptocurrencies are known for their sudden fluctuating trends but this week has been full of ups and downs-mostly downs. The downward corrections have been testing the significant support levels for all cryptocurrencies.
Bitcoin has seen a stable upward trend after a while as the price rises above the resistance levels of $10,250. Bears tried their best to pull the price further lower towards the support levels of $9,800 and critical support level of $9,500, but it was surprisingly well supported around the $10,000 level.
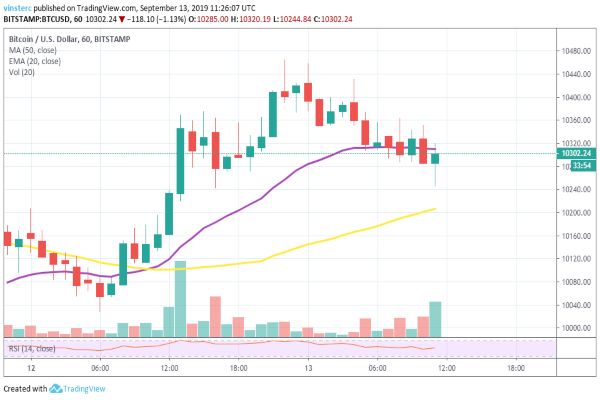
Currently, Bitcoin is trading at $10,302.24, and strong resistance can be seen forming near the $10,350 level as the price struggles to go up. Major resistance is seen at $10,450 and $10,500 level.
Immediate support can be seen, forming near $10,250, followed by $10,150. Key support levels are forming at $10,050, and if a downward correction strikes the charts, then we can expect the price to go below and test the support levels of $9,800 and below.
ETH/USD
Ethereum noticed a change in in the charts as the price went up just before the trading day was about to end. Ethereum broke the resistance level and went all the way up till $182, but soon it went bearish and came down.
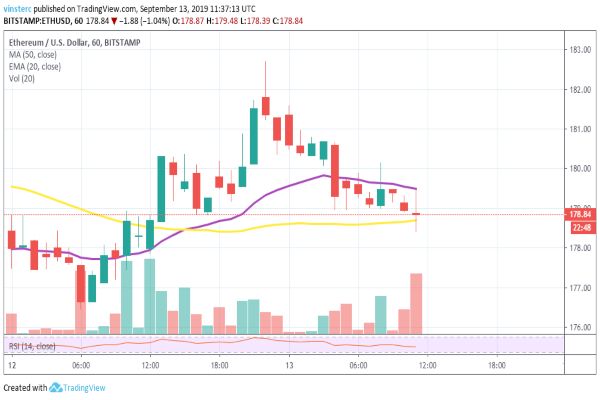
Currently, ETH is trading at $178.84, and strong resistance can be seen near $182. An immediate support level is available at $176 as price tries to break through the resistance moving upwards in the charts.
If the bulls take control of the market, then we can see the price heading towards the $182 and $185 resistance levels. Major resistance is present at $188 and $190 while in case of a downward correction, the price can go below $176 and test the support levels of $172 and $170.
XRP/USD
Ripple is somewhat stable right now as compared to other cryptocurrencies. The 50-days MA and 20-days EMA, both are moving along the trade line as XRP continues to stay stable.
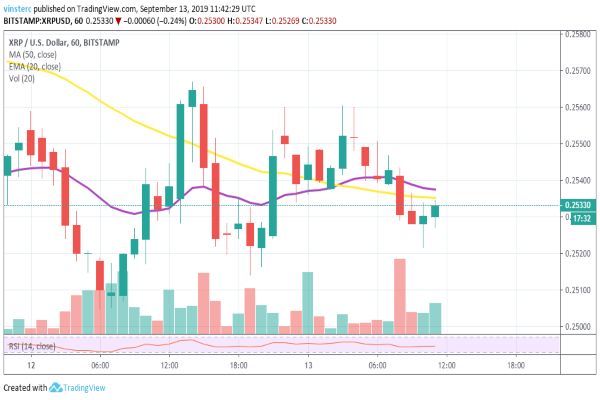
Currently, XRP is trading at $0.2533 with immediate support forming at $0.2510 while resistance can be seen at $0.2580. The bulls have been able to hold the trade prices within the resistance and support levels very well.
In case a downward trend continues, we can expect the price to test the support at $0.2510 and go further below towards the support levels of $0.2480 and $0.2450. In case the bulls push the price upwards, we can see a climb towards the $0.2600 resistance level.
LTC/USD
Litecoin is slowly declining towards the support level of $68 as the bearish trend continues in the market. The moving averages are facing downward as the RSI also declines below the 50% mark.
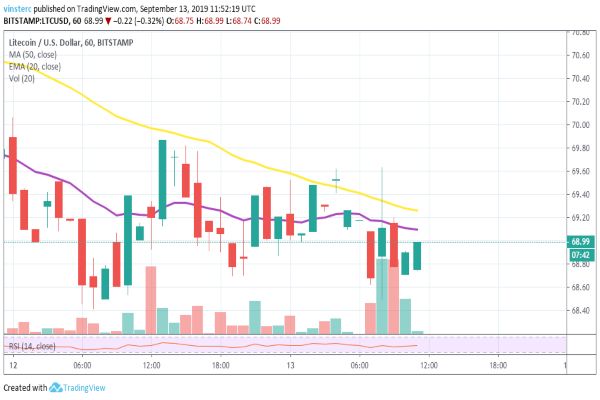
Currently, LTC is trading at $68.99 as strong resistance forms near the $70 level. Immediate support has shifted from $68 to $67.50 as the price continues to decline. A slight upward trend can be seen forming in the charts as the price tries to climb towards the resistance level.
Further downward correction can bring the price down to $67 and make it test the support levels present at $66 and $64.
BCH/USD
Bitcoin Cash was trying hard to go to towards the major resistance levels as it crossed the immediate resistance level of $300 and traded at $301.82. The bulls couldn’t hold the position and the drop followed as BCH went bearish.
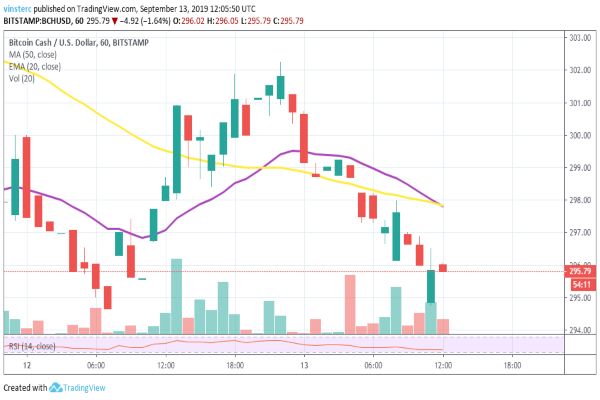
Currently, BCH is trading at $295.79 as strong resistance forms near the $301 levels while immediate support is present at $294. A slight upward trend can be seen in the charts as the price struggles to move up towards the resistance levels.
Major resistance can be seen forming near the $305 level, but in case the price faces a downward correction, we can expect the price to go further down and test the support levels of $290.


