

All the cryptocurrencies are having a hard time as the bearish trend continues to affect them. The bullish trend is facing a halt as the prices are having trouble climbing up and beyond the resistance levels.
Bitcoin is maintaining stability between the $10,100 support level and $10,250 resistance level by trading between them. An upward trend can be seen forming in the charts as the price slowly moves towards the resistance levels of $10,200 and $10,250.
The bulls are trying hard to push the price towards the resistance level and even beyond that, but the progress is very slow as the price maintains a stable trend for growth.
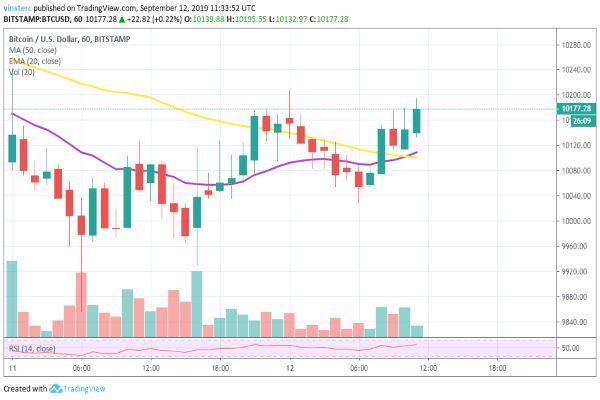
Currently, Bitcoin is trading at $10,177.28 with an upward trend forming in the chart. Strong resistance can be seen near the $10,200 levels, and immediate support level is forming near $10,050. The moving averages are crossing each other as 20-days EMA goes upwards while 50-days MA comes downwards.
If a bullish trend forms, then we can expect the price to go beyond $10,200 resistance levels and bulls will try to take the price higher towards the major resistance of $10,500. In case a downward trend occurs, we can expect the price to go beyond the $10,050 support levels, and if the downward trend continues, then we can expect the price to test the support levels of $9,900 and 9,500.
ETH/USD
Ethereum is slowly moving downwards as it faces the wave trend for the price as it fluctuates between the support and resistance levels. The moving averages are coming together with the tradeline, and the trade goes slightly bullish.
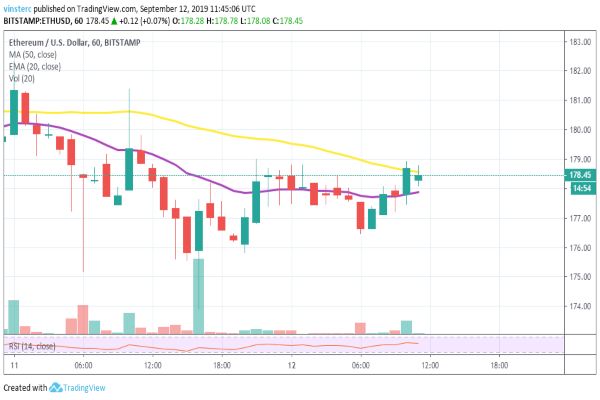
Currently, ETH is trading at $178.45 as the resistance forms near the $179.50 level. The support levels are forming at $176 as the price continues the slow bullish trend. The RSI is slightly above 50% mark, which is the positive trade zone.
If a downward correction takes place, then the decline in the price can reach the support levels of $176, and if the trend continues, then the price can test the key support levels present at $172 and $170. If the bulls provide a push to the market, the price can go beyond $179 resistance level and head towards the major resistance level of $183 and $185.
XRP/USD
Ripple is struggling to gain a rise in the trading price as it continues to decline further in the charts testing the support levels while moving away from the resistance levels.
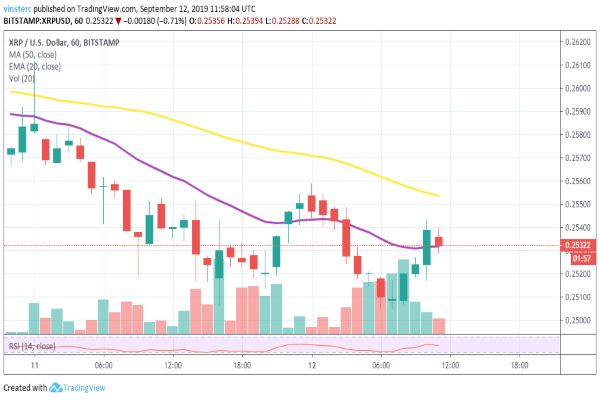
Currently, XRP is trading at $0.2532 as strong resistance can be seen forming near 0.2558, and the immediate support level is forming at $0.2504. The bulls are trying to hold the positions, but bears have the upper hand this time as the price slowly declines in the charts.
If the downward trend continues, then we can expect the price to reach the support level of $0.2504. If a further decline takes place, the price will go further to test the support levels of $0.2480 and $0.2450. In case the bulls are able to defend the position and close the market above $0.2540, we can expect the price to rise. If the price goes above $0.2580, then it can go further towards the $0.2600 resistance level.
LTC/USD
Litecoin has further declined from its position at $70 and closer to the support level of $69. The charts trade is taking place below the moving averages so we can expect a further decline in the price.
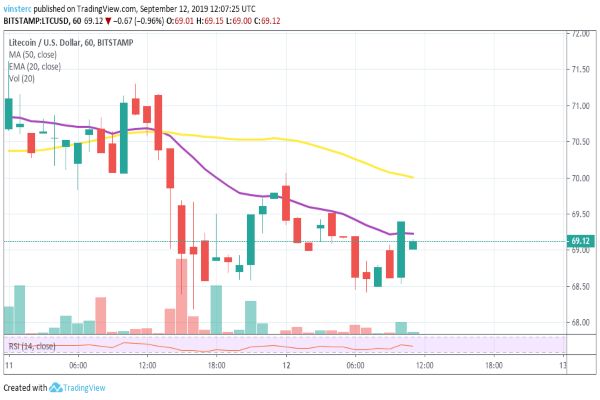
Currently, LTC is trading at $69.12 as the 20-days EMA is moving along the trend line. Strong resistance can be seen near the $70 level while immediate support is forming at $68. The price is experiencing a further downward correction as the bulls are trying hard to defend the position.
If the bearish trend continues, we can expect the price to go beyond the support level of $68 and further test the major support levels at $66. In case, bulls try to change the pattern of the market; we can expect the price to break through the resistance level of $70 and move towards $73 resistance level.
BCH/USD
Bitcoin Cash saw the months lowest yesterday as it went down towards $293 for some time, but an immediate push was seen in the charts as the price went upwards again.
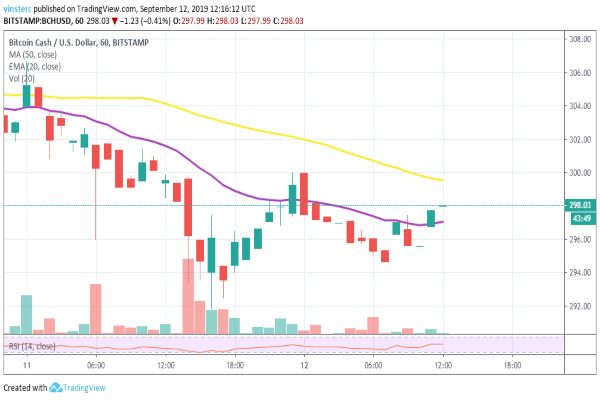
Currently, BCH is trading at $298.03 as the price moves between the moving averages. Strong resistance can be seen forming near the $300 level while immediate support level forms at $294 as the price further moves downwards.
If the upward trend continues, we can expect the price to move up and reach the resistance levels of $305 and move further. In case the downward trend continues, which is most likely to happen, we can expect the price to go to $294 and further decline and test the support level of $290 in the worst-case scenario.


