

Bitcoin is under a bear attack as the price is further declining and testing the crucial support levels. Last week, Bitcoin saw a strong bullish trend in its trading price, but things changed when it entered the second week of the month.
The price is going downhill as it is testing the support levels with the downward correction. Yesterday, in the daily analysis of Bitcoin, we discussed how Bitcoin was facing strong resistance at $10,300 while a crucial support level was forming at $10,100, $10,050, and $10,000. Today Bitcoin tested the support level of $10,000 as it further declined from yesterday’s trading level of $10,235.
A bearish trend is forming in the rest of the cryptocurrencies as we move towards the end of the second week. The altcoins are either trading near the respective resistances or below them.
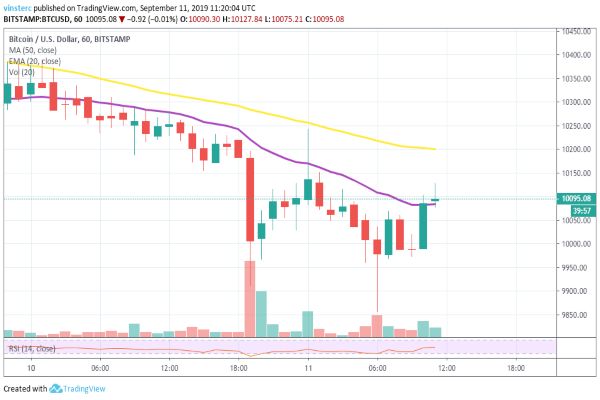
Currently, Bitcoin is trading at $10,095.08 with an immediate support level forming at $9,950. If the downward trend continues, we can expect the price to go further down to reach $9,900 and $9,800. If the bears continue to hold Bitcoin’s leg, we can expect the price to test the major support levels of $9,600 and $9,500.
Strong resistance can be seen forming near the $10,200 with key resistance present at $10,250. If the bulls interfere in the market, they can provide the push to Bitcoin and price can break through the resistance levels of $10,250 and move further above. Key resistance is present at $10,500, and if the price moves above it, we can expect the price to rally towards the $11,000 level.
ETH/USD
The bearish wave in the trading price has finally moved from Bitcoin and is hitting the other cryptocurrencies as well. Ethereum, after being in the upward trends, ETH has faced a bearish attack, and its price is declining as a downward correction forms in the charts.
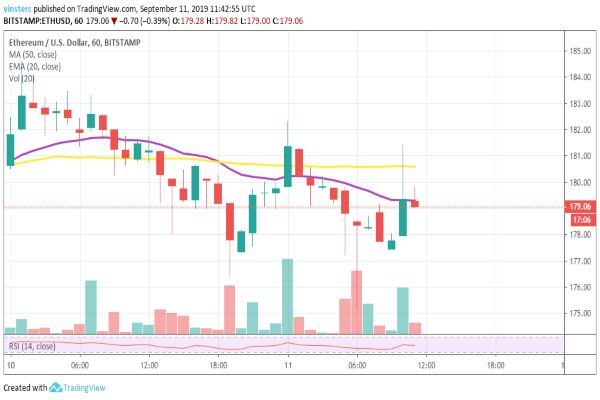
ETH price tried its best to move further the $185 resistance and rally towards the next major resistance, but a downward correction entered the chart. Currently, Ethereum is trading at $179.06 as the moving averages move parallelly with the trade line. Strong resistance can be seen forming near the $182.50 level as an immediate support forms around $175.
If the bearish trend continues, the price struggles to move above the resistance levels of $182. Any further downward correction can take the price further down the $175 support level, and it can test the major support levels of $172 and $170.
XRP/USD
The bullish trend for Ripple didn’t last long as the price took a dip towards the key support levels of $0.2550 and $0.2500. Ripple was finally moving towards the major resistance level of $0.2700, but the interference by the bears pulled the price downwards.
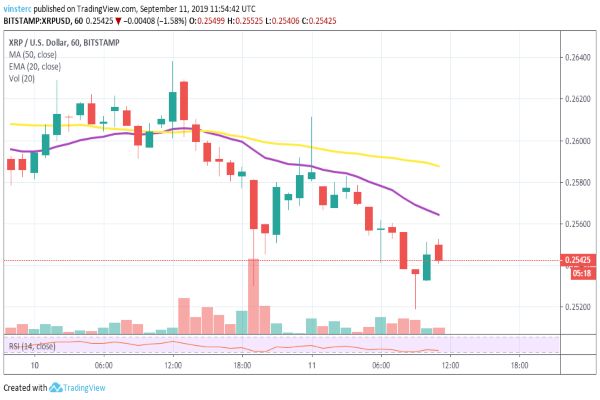
Currently, XRP is trading at $0.2542 as a strong resistance can be seen near the $0.2610 level, and the support is forming near $0.2510. Any further decline will take the price to the support levels of $0.2500 and $0.2480 with a key support level forming at $0.2450.
If the bulls provide a push to the price, we can expect the price to go beyond the resistance levels of $0.2610 and rally towards the resistance level of $0.2680.
LTC/USD
Litecoin is trading at an almost stable rate as the trading is carried out near the support level of $69. The price faced a downward trend today as the trading began, and it tested the support levels as it declined towards $69.
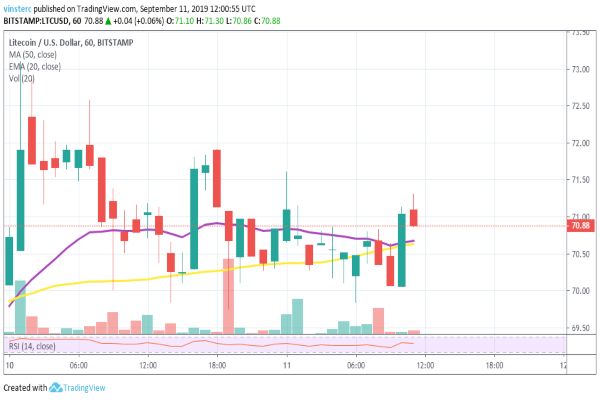
Currently, LTC is trading at $70.88 with strong resistance present near $72 and immediate support forming near $68.50. Any further decline in the price will take it down towards the support levels of $68.50 and $67. If the downward correction continues, we can expect the price to test the support levels of $66 and $65.
A bullish trend can push the price beyond the resistance levels of $72 and aim for the key resistance level present at $75 level. Once it crosses the major resistance, a strong bullish trend can be expected.
BCH/USD
Just like all the cryptocurrencies mentioned above, BCH also faced the bear’s attack as the downward trend can be seen through the charts. BCH was trading slightly above $305, but the bearish trend pulled the price down towards the key support levels.
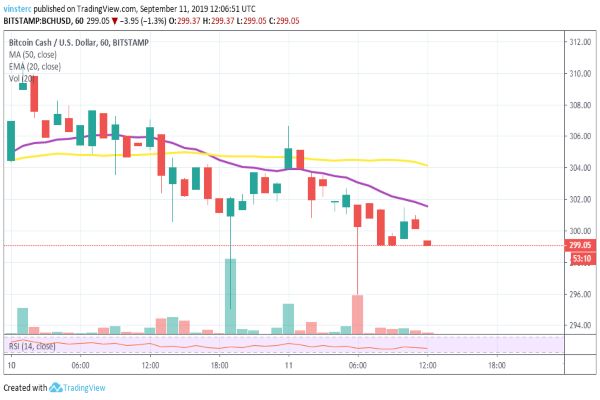
Currently, BCH is trading at $299.05 as strong resistance can be seen forming near the $306 level with immediate support forming near the $295 level. Further downward correction can take the price towards the critical support levels of $292 and $290 whereas a bullish trend will aim towards the resistance levels of $310 and key resistance at $315.


