

The last week has been a rollercoaster ride for Bitcoin as we saw some serious downward corrections followed by upward trends. Bitcoin started the week at $11,530 and then saw a sudden downward correction to the price of $9,830 around 15th August, and it finally closed the week with an upward trend at $10,410.
Recently we noticed that the Bitcoin price was affected by the US-China trade war as we saw an increase in the price at the beginning of this month. Now things are coming back to normal between US-China so we can expect changes in the price of Bitcoin again.
Bitcoin is currently trading at $10,702 after breaking the strong resistance of $10,500 and $10,600. A bullish trend can be seen forming near the $10,300 support level. There is a decent support forming at the $10,300 and $10,250 level. This is the same level where we can see the formation of a bullish trend in the hourly chart of Bitcoin.
The bulls need to defend the $10,500 resistance levels; otherwise, Bitcoin can decline back to $10,000 and test those levels. To continue the bullish trend, they will have to break the $10,800 resistance level to gain a steady pace in the rise. If this happens, then the prices can reach well above the $10,850 and $11,000 resistance levels.
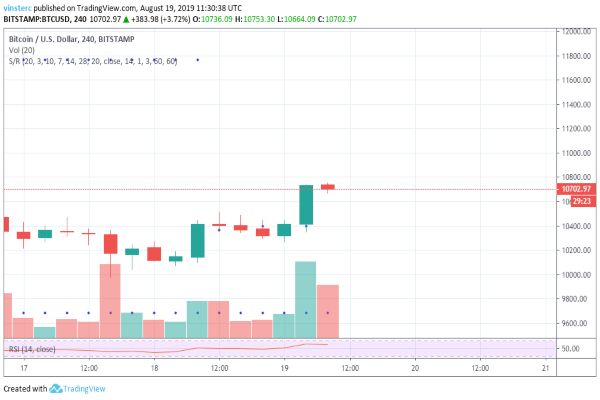
The chart, however, gives us hopes that Bitcoin price will approach the $11,000 mark and if it faces a downward correction in the coming week, then it might test the support levels of $10,000 and $9,900. The RSI has improved from 46.33% to 62.08%.
ETH/USD
With the improvement in the price of Bitcoin, Ethereum has shown improvements in its price since 17th August. Ether is currently trading at $202.36 after breaking the resistance levels at $195.
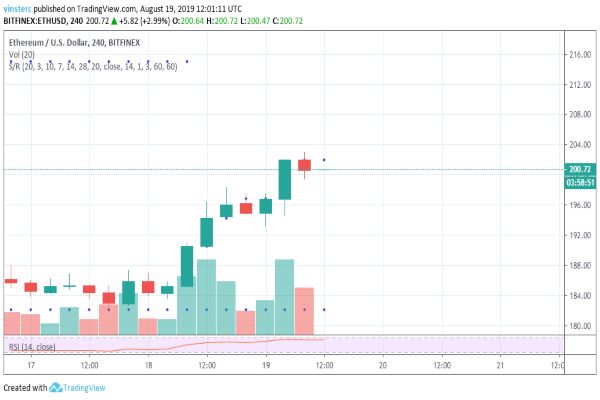
The bullish trend can be seen in the Ethereum chart as well since 17th August, pulling up to $202. This has made the support levels to improve to $188 with a resistance level at $203 and $204. With this breaking of the $195 resistance level, we can hope for a rise till $204 and then it is likely to continue higher towards the $208 and $210 levels.
The primary support levels for Ethereum are present at the $190 and $188 levels.
XRP/USD
Ripple has been facing downward corrections in the last week as well, but with an increase in Bitcoin price, Ripple noticed a climb in the price too. Currently, XRP is trading at $0.28480 against the US dollar.
Ripple was facing the resistance at $0.2750 and $0.2800, and it broke the resistance barriers to having a good start this week. Next resistance is at $0.2900 and $0.3000 mark if the bulls can defend this level.
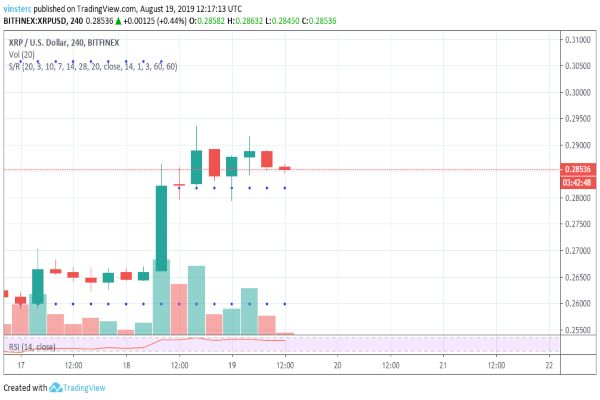
In case of any downward corrections, we can expect the support to be at $0.27950 and $0.27500 levels. The chart clearly shows that Ripple is closing in towards the $0.2950 barriers. This can lead to a pump of price towards the $0.3000 levels.


