

The past few days have been troubling for Bitcoin as the bulls are trying their best to bring in a bullish trend in the market. But it seems like the bears are dominating the market as they have maintained the price below the resistance levels.
However, the story has been different for other coins like ETH and XRP as they rally beyond the major resistances and aim for a new ATH for the month. With the looks of it, it feels like the bulls have shifted their focus towards other cryptocurrencies as they see a surge above the resistance levels.
Currently, Bitcoin is trading at $10,152.61, and a strong resistance can be seen forming near the $10,300 level as the bulls fail to maintain an upward trend once the price is near $10,300. Immediate support level can be seen, forming near the $10,050 and $10,000 levels.
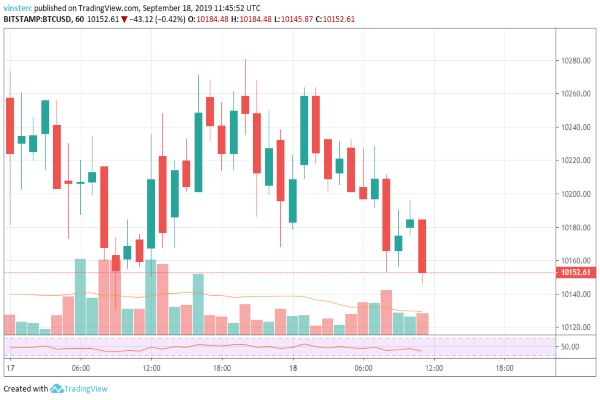
If the price breaks the bearish trend, then it will move towards the resistance levels of $10,300, and from there it will head towards the key resistance of $10,500. In case there is a further downward correction in the charts, we can expect the price to go further down and test the support levels present at $9,900 and $9,500.
ETH/USD
Ethereum has been proving itself as a good place for investment for the investors from the past 2-3 days as the price is breaking the resistance levels that are present. It broke the resistance levels of $200 and $210 as the price moves towards the $220 levels.
Currently, ETH is trading at $211.18 as the bullish trend in the market continues making the price rally towards the new resistance levels. Strong resistance can b seen forming near $218 as the price moves towards the major resistance levels of $220 and $225.
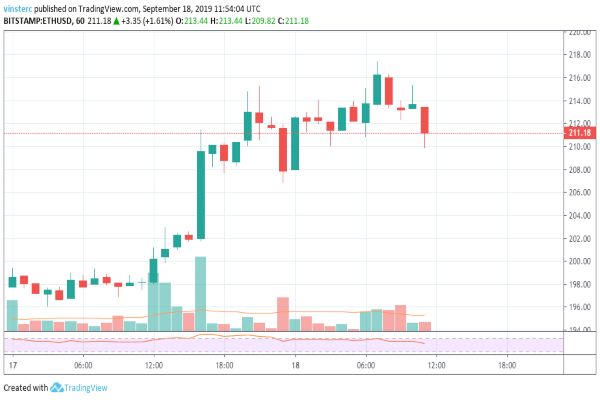
Immediate support levels for Ethereum can be seen, forming at $208 level as the price moves upwards. If the price remains bullish, we can expect the price to reach $220 and $225 levels of resistance. In case there is a downward correction in the chart, the price will test the support levels of $208 and $205. Any further decline in the price will make the price test the support levels of $200 and $198.
XRP/USD
Ripple is set on a path to prove its worth as it gets strong support from the bulls. Despite the excessive dumping of XRP tokens by Ripple, the price is taking the highway as a steady upward trend forms in the charts.
Currently, XRP is trading at $0.3034 as the price broke the resistance levels of $0.2850, and it is headed towards the strong resistance, which is present at $0.3150. Immediate support levels can be seen, forming at $0.3000 and $0.2850.
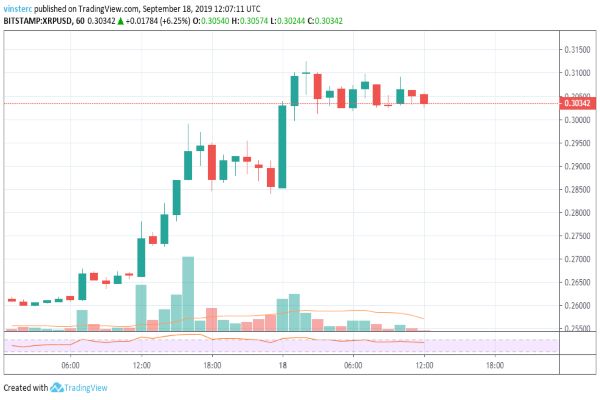
If the upward trend continues, we can expect the price to move ahead and rally towards the resistance levels of $0.3150 and $0.3200. In case the bears enter the market and pull the price down, we can expect the price to move towards the support levels present at $0.3000 and $0.2850. Further, a downward correction will take the price to test the support levels at $0.2800 and $0.2700.


