

LTC/USD Dominant Trend: Bearish
Resistance Levels: $130, $135, $140
Support Levels: $80, 70, $60
Litecoin Price Analysis
Litecoin price is trading not far from $104 in bullish momentum. In recent days, the price is limited in the range of $98 down to $105 to the upside. A little above the current price, the 100-day simple moving average will prevent growth to $104, while the 50 MA currently at $106 will limit gains. Litecoin price will probably remain on the range limits in the coming days. The Relative Strength Index (RSI) points up after testing the levels at 30. The indicator above 50 will encourage the bulls to gain more confidence in the upward momentum.
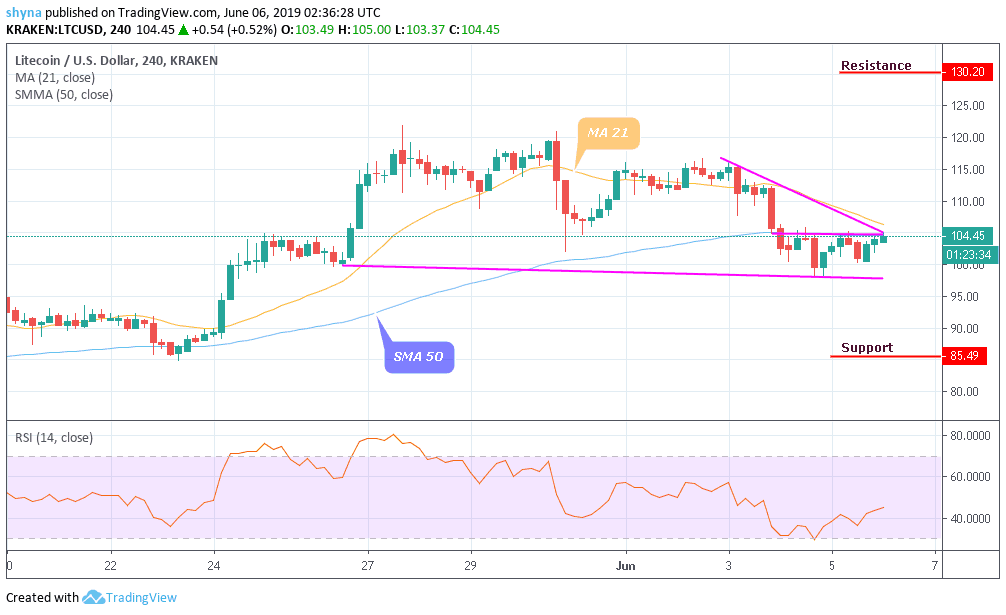
Litecoin now follows a lateral movement. The recent price increase was revealed in the 4-hour RSI, since it is currently arriving at the center, indicating that the price will soon change to rise. Bearish is likely to play at any time from now. In the RSI, Litecoin price has returned to the activity above level 45. The 4-hour chart shows that a head and shoulders pattern has been formed, with the pair nearby from the edge of the bullish structure. As the price of has increased, it can be predicted that LTC will continue its uptrend in the short term. In the long term, the market will emerge with huge price increases but at a slower pace.


