

The current situation in the commodities market has left its impact on the cryptocurrency universe as well. Crude oil prices fell below $0, and with that, the happy phase of various cryptocurrencies such as BTC, ETH, LTC, and XRP was cut short.
ETHUSD price analysis and prediction
To begin the analysis, first, let’s take a look at the four-hour timeframe for ETHUSD.
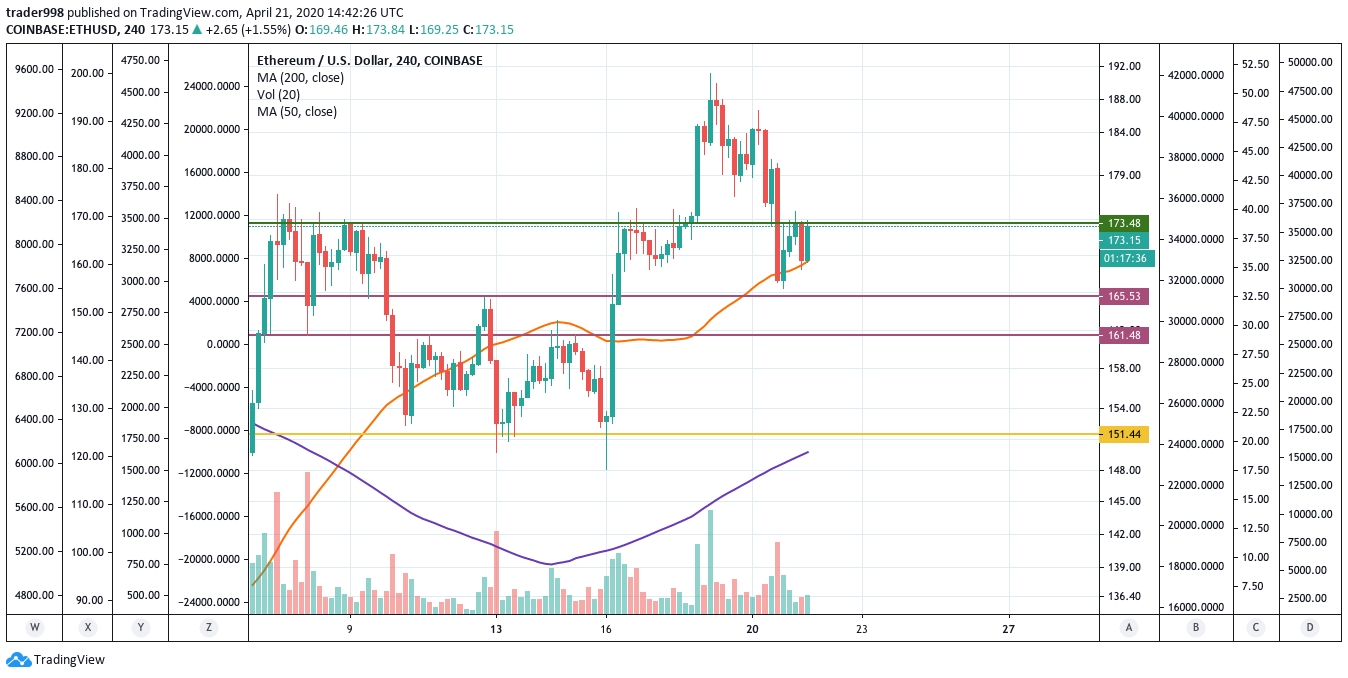
- The day’s range for Ethereum is $168.53 — $174.73. The large red candle can clearly distinguish the drop that took place on April 20.
- An important aspect to note here is that this decline was relatively less steep than Bitcoin’s drop. ETH seems to have bounced back following its fall.
- Ethereum is currently trading at $172.73, just below the resistance at $173.48. If Ethereum succeeds in breaking above this resistance, this will act as new support. The supports lie at $165.53 and $161.48.
- ETHUSD is likely to move in the consolidation zone in the short term. However, improvements in the macroeconomic conditions will again push ETH higher.
Check ETHUSD Chart on TradingView.
XRPUSD technical analysis
Here is the hourly chart for XRP.
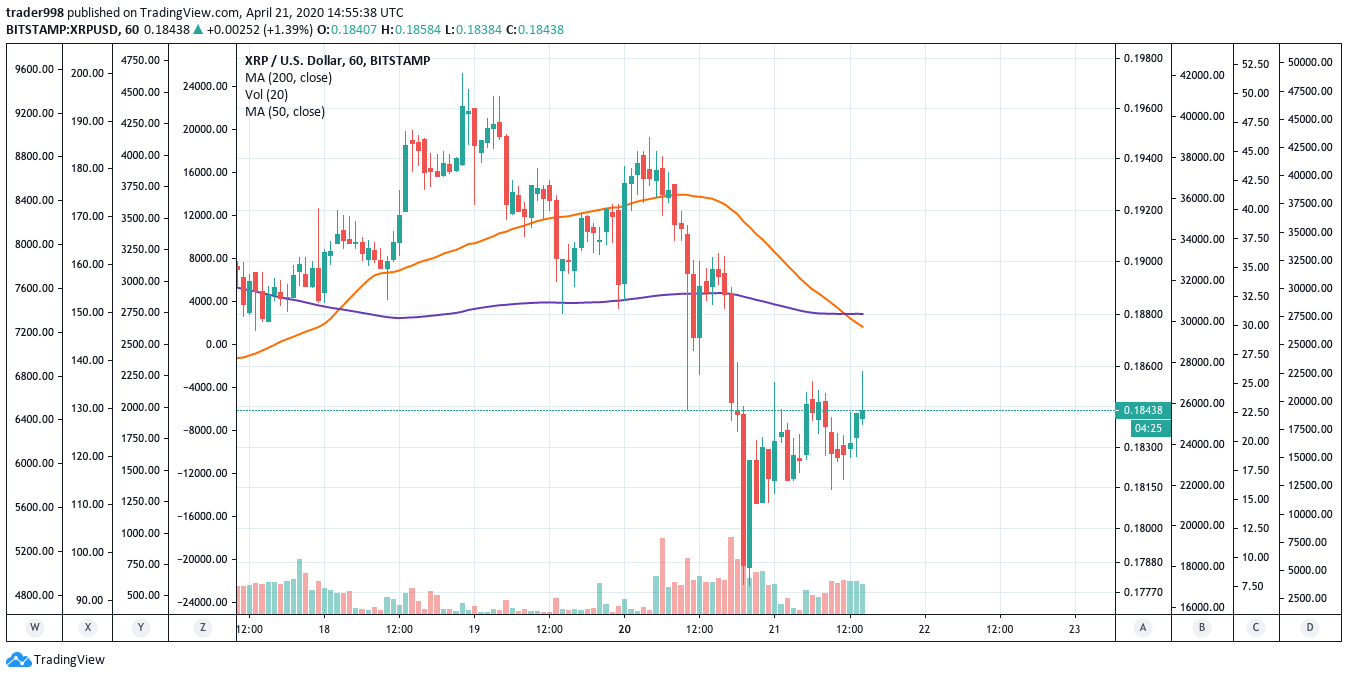
- Ripple seems to have turned more bearish than BTC and ETH. The decline was quite steep for Ripple. It rose from its day’s low; however, XRP is not yet out of the woods.
- The hourly chart indicates that even though XRPUSD increased, the green candles had a tiny body. On top of that, the highs formed are getting lower. On the other hand, the lows are getting much lower. This is an apparent bearish movement.
- Most of the moving averages point to a ‘strong sell’ signal in the short term for Ripple. The MACD downward crossover is also a sell signal.
Check XRPUSD Chart on TradingView.


