

Dominant bias for IOTA (IOT)- Bearish
Resistance Levels- $0.5400, $0.5600, $0.5800
Support Levels- $0.4400, $0.4200, $0.4000
IOTA is in a bearish trend. Rejection to continued bullish pressure occurred at $0.5275 in the resistance after the close of the candle as an inverted hammer. MIOTAUSD dropped initially to $0.4834 on 26th October and later to $0.4691 in the support area on 28th October.
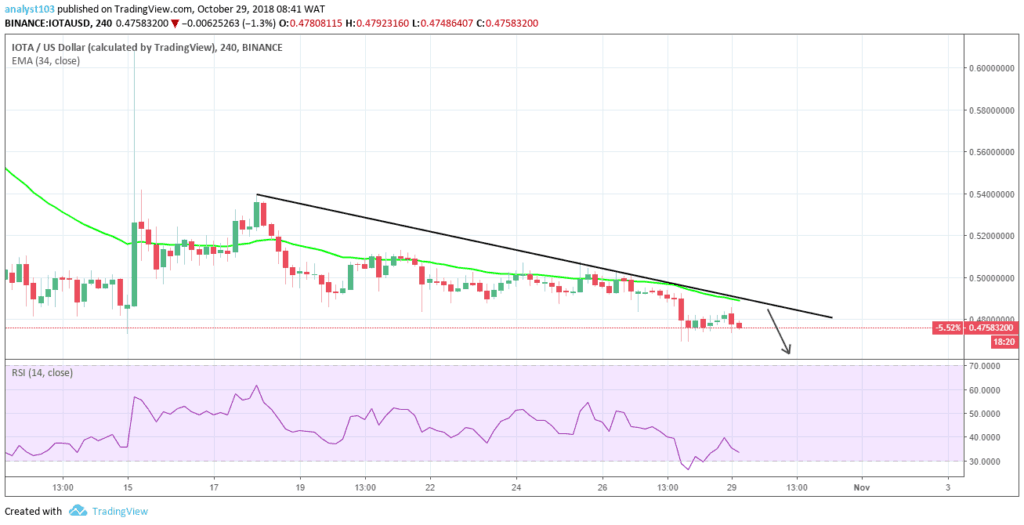
The bearish 4-hour opening candle at $0.4827 sustained the bearish pressure and ensures that the cryptocurrency went down to $0.4732 in the support area earlier today
IOTA Price is below the 34 EMA and the relative strength index at 32% which is still sellers’ zone, these suggest downward movement in the price of the cryptocurrency due to the Bears’ pressure.
With more candles formed and closed below the 34 EMAs and the trendline, $0.4400 in the support area may be the bears’ target before the end of today’s trading session.


