

Technical Markers
Support Level – $103
Resistance Level – $107
- Ethereum price was unable to break the $108 resistance level, with a bearish pattern.
- There is a new bearish trendline formed with resistance around $107 on the hourly chart of ETH/USD.
- Ethereum price can fall underneath the $100 level if there is a bearish break beneath $104.
Ethereum price is framing a bearish pattern. ETH/USD stays in danger of more troubles as long as it is unable to break the resistance around $107.
Ethereum Price Analysis
Ethereum price recovered a little yesterday over $104. ETH was unable to break the resistance level around $107 as a result Ethereum price fell below $106. The price is currently ensured by the support around $103 level.
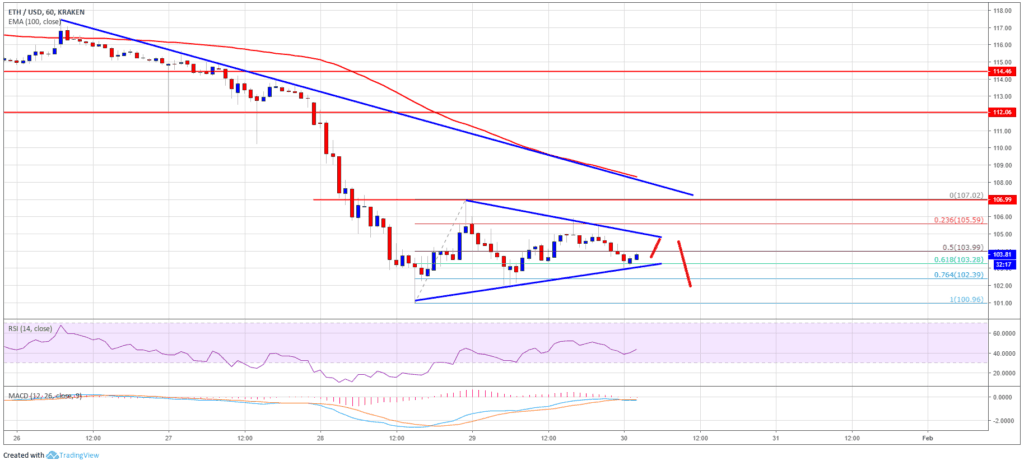
There is a bearish trendline formed with resistance around $107 on the hourly chart. If Ethereum is able to break above the resistance around $107, the price may move towards the $110 and $112 levels. However, if there is a downside break underneath $103 support level, the price is probably going to fall below $100 very quickly.
Taking a look at the chart, ETH price is obviously under selling pressure underneath $107. If the selling pressure keeps on increasing, the price is probably going to fall underneath $103 to below $100.


