

ETH USD Dominant Trend: Bullish
Resistance Levels: $295, $300, $305
Support Levels: $250, $245, $240
Ethereum reached a maximum of $271.44 during the first Asian hours of Thursday, June 20 and at the opening of the market today (June 21), the price of ETH/USD reached $278 at the time of writing this article. The second largest cryptocurrency, with a market capitalization of $29.7 billion, has hardly changed since the beginning of the day and since then. An average daily trading volume for ETH is $6.8 billion. From a technical point of view, a sustainable movement of more than $270 has improved the technical situation in the short term. However, we will need a follow-up so that the recovery returns to normal. Above the black line of the 50-day moving average, the closest resistance expects ETH bulls to be at $280 (an upper line of 4-hour Bollinger Band). Once this has been resolved, the upside potential will likely gain popularity with the next approach at $285 (more than the June 17 high) and $285 in psychological rates.
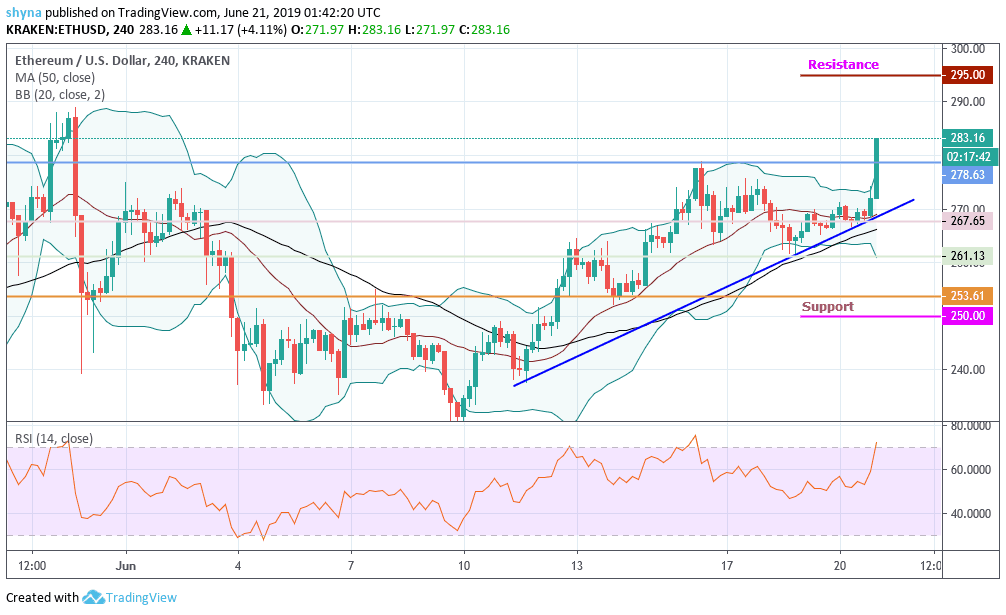
On the downside, the sale could be limited to $266. This barrier is created by the average line of the 4-hour Bollinger Band and the broken upward trend line. A sustained movement below this zone would pave the way for $265 (a moving average (MA) 50) and $262 (lower boundary of 4-hour Bollinger Band). The next support awaits the bears when its approach $255 in psychological rates. If it breaks, the sale may continue at $250, $245 and $240 respectively. The 4-hour ETH/USD market had a formation of triangles from which the market broke. The market has found a supply at the $280 level and the trend is above the upper limit of the Bollinger Band indicator since the signal line of the Relative Strength Index (RSI) is heading towards the overbought territory, which indicates a strong increase and a likely return to the test at the nearest time.


