

Ethereum has lost its momentum and seems to be losing its previous gains steadily. ETH has already lost 1.03% since its last close and is currently trading around $156.80.
Ethereum horizontal movement is a reason to worry.
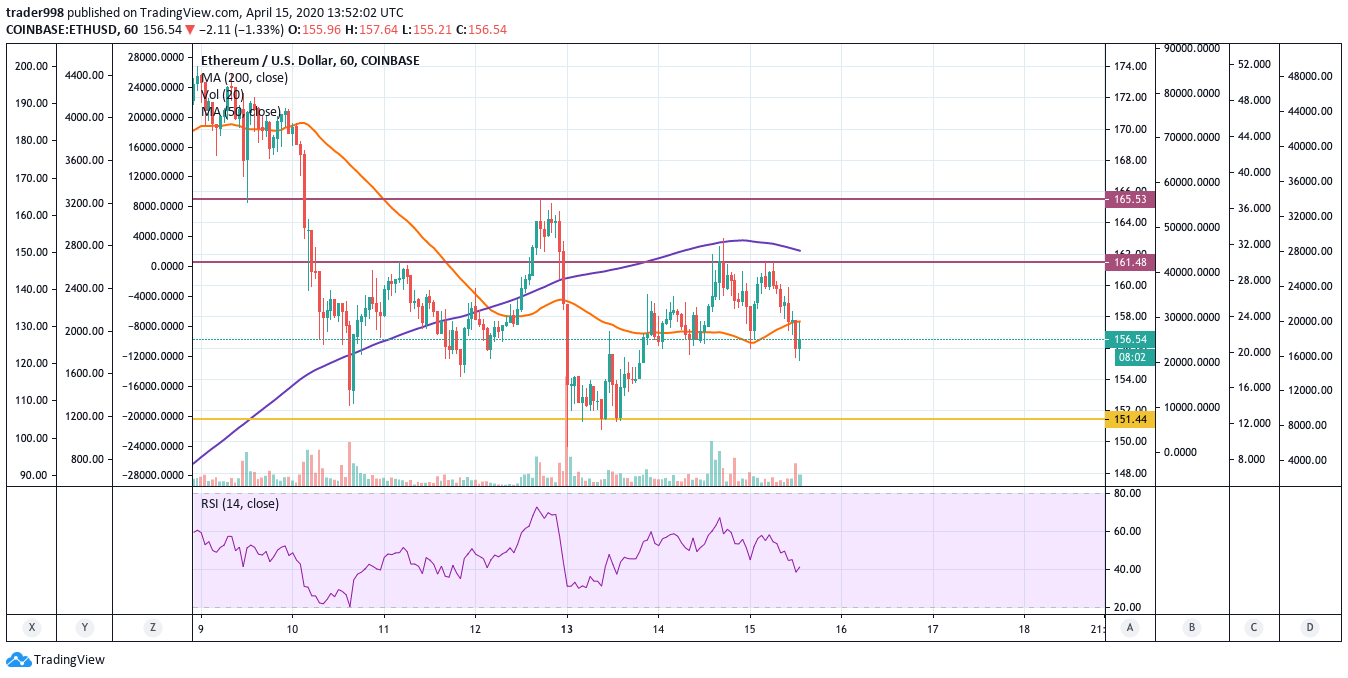
ETH/USD Chart Published on Tradingview.com
- The day’s range for Ethereum is $155.21 — $161.50. The hourly chart for ETHUSD shows that Ethereum faces a resistance zone lying within the price band of $161.56 – $ 164.47.
- Ethereum has retested the $161.48 resistance level at least five times and has rebounded. The next support lies at $151.44.
Possible trading scenarios for Ethereum
- Ethereum retesting the first resistance level of $161.48 would create an opportunity for trade in case Ethereum doesn’t consolidate at that price.
- If it is successful in breaking the resistance level of $161.48, ETHUSD could reach till $165, which would provide a small window of entering a ‘long’ position.
- In case Ethereum breaks the second resistance level at $165, ETH could gain another 10%, which would be another opportunity to enter a long position.
- However, upon retesting the first resistance level, if Ethereum starts dropping, it could reach the support at $151.44. In that case, another opportunity for entering a short position would arise.
The current scenario and economic conditions would also play a vital role in the ETHUSD price movement.
- As far as the COVID-19 situation is concerned, financial stability is up for a toss. Equity markets are seeing volatility like never before. Investors are ditching riskier assets.
- Even Bitcoin, which was the golden asset of the last decade, seems to be falling downhill.
- However, with certain situations poised against the Bitcoin, this might be the turning point for Ethereum. The liquidity in ETH could be a game-changer.


