

ETHUSD Dominant Trend: Bearish
Supply Level: $300, $350, $400
Demand Level: $205, $170, $135
Ethereum Price Analysis:
The Ethereum price on Tuesday was offset by losses of around 1.7% in the final stages of trading. Ethereum price is just above an area of indispensable demand, supporting the price at present, after a wedge breakout seen via the hourly chart. You can see a decent demand level from $205 to $135, which could be critical. According to the 4-hour chart, the price is still trading below the 100-day MA, while the red bar of the MACD histogram confirms that the price still obeys the downward trend. Clearly, due to the recent downward trend in ETH to USD, the price has returned to $231 currently from $234 at the time of writing this article, and the price is likely to cross the channel down pattern to resume the upward trend, should in case it happens, then you could expect more growth for Ethereum price today.
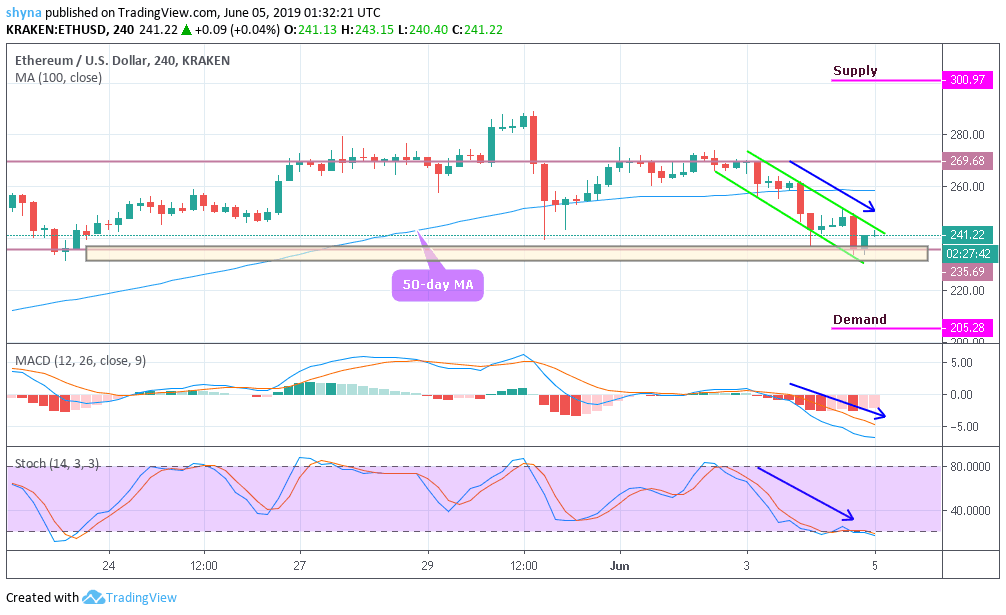
However, the stochastic 14 signal line is trying to see if it can penetrate into the oversold territory, which indicates a slight decline in the market and, once that happens, buyers will continue to lose control of the market. If prices fall towards the level of demand, Ethereum price will likely fall to a support level of $205 if the price does not exceed the established price level. The market is currently undecided because the next move is still unknown, as the market could move sideways, but the MA 100 remains a defensive line for sellers.


