

Ethereum to USD Dominant Trend: Bearish
Supply Level: $280, $290, $300
Demand Level: $205, $195, $180
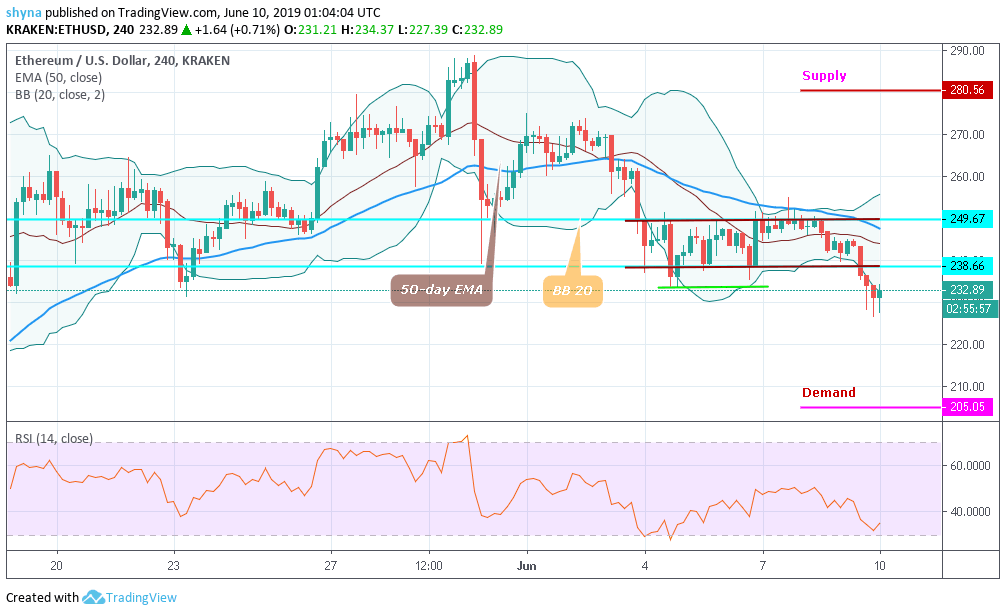
Currently, the ETH/USD is quoted at $232. Cryptocurrency prices trade below the moving average for a period of 50 days, indicating a downward trend in Ethereum. For the time being, the cryptocurrency quotes move to the lower edge of the Bollinger band indicator. In addition, we expect an attempt to continue the increase in the ETH/USD and the development of the uptrend. The purpose of this move is to provide near the supply level of $280. The conservative supply level for Ethereum purchases is located near the lower limit of the Bollinger Bands indicator, at the level of $280. Any attempt by buyers canceling the option to continue reducing the Ethereum rate would be equivalent to breaking down the demand of the lower edge of the Bollinger band indicator.
However, after breaking the lower edge of the Bollinger Band indicator, this will also affect the moving average with a period of 50 days and the closing of the coin price below the demand level of $205. This will indicate a change in the current trend towards the decrease of ETH/USD. In case of a breakout in the upper limit of the Bollinger Bands indicator, acceleration in the increase of the cryptocurrency is expected, which implies a supply level of $280 or more. The area reserved for the purchase of Ethereum is available in $300. By canceling the increase option, the cryptocurrency will be a decomposition of the demand level of $180. In this case, we can expect more falls as the signal of RSI 14 is trying to reach the oversold territory.


