

Technical Indicators:
Support Level: $165
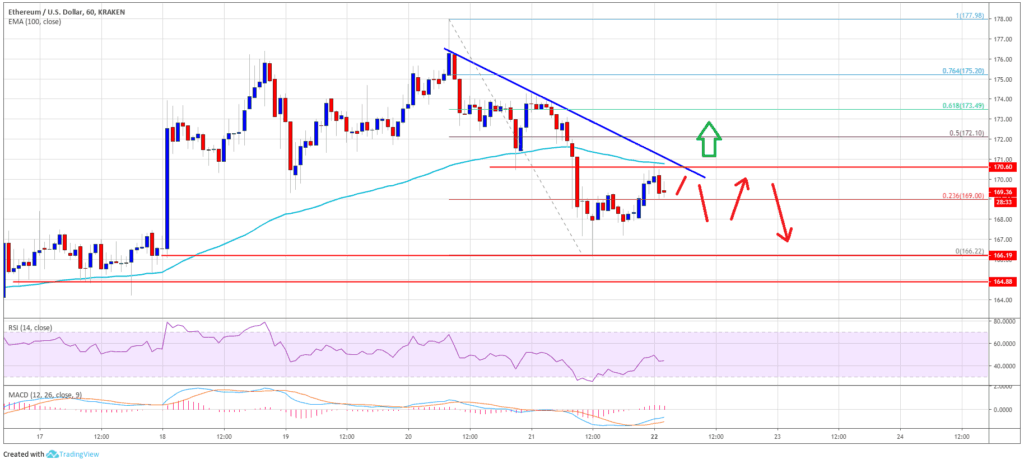
Resistance Level: $170-171
Key Points:
- Ethereum price broke above the $175 resistance level before correcting downwards.
- ETH tried to test the $180 resistance zone, however, the selling pressure pushed the price below $170.
- A bearish pattern is formed with resistance around $170 on the hourly chart.
- Ethereum price will most likely fall towards $165 support level in the short term before starting a fresh upward move.
Ethereum Price Analysis:
Summary: Ethereum price corrected downwards against USD. ETH might test the $165 support level before it could start an upward spike and break through $170 resistance level.
Last week, Ethereum price traded in a bullish momentum after breaking through $170 resistance level. ETH was able to move over $174 and $175 resistance zone, however, there was a lot of selling pressure around $178 which led to Ethereum crashing downwards below $170 and 100 hourly SMA. The support around $165 proved strong enough to push the price upwards.
The buyers were able to push the price upwards from $166 to around $170. However, the 100 hourly SMA and the strong resistance around $170 is proving to be a barrier for ETH to rise further. A bearish pattern is being formed with resistance around $170 and $171 on the hourly chart which might push the price back to $165 support range. If Ethereum price is able to break above the bearish pattern, it might test the $178-180 resistance zone soon. However, there are strong chances that Ethereum will test the $165 support level again before starting an upward move.
The major support for ETH lies around $165 below which it might fall below $160. On the upside, an initial resistance is around $170 above which Ethereum might test $178-180 resistance zone.
The chart shows that Ethereum price is currently facing a lot of selling pressure which might push the price towards $165 support level. However, the medium and long-term momentum seems quite bullish and Ethereum might break through the $170 resistance zone in order to test $180 level again and move into a positive zone.


