

Technical Indicators:
Support Level: $155
Resistance Level: $180
Key Points:
- Ethereum price started to rise again breaking through $160 resistance level.
- After rising up to $180, ETH started a downward correction.
- A bullish pattern is being formed on the hourly chart with support around $153.
- Ethereum price will remain bullish if it breaks through $180 resistance level.
Ethereum Price Analysis:
Summary: Ethereum price is currently trading in bullish momentum. ETH might break through $180 resistance level towards $200 if buyers remain in action.
ETH price momentum became quite bullish this week after breaking through $140 resistance level. Ethereum price settled well above $155 resistance level and the 100 hourly SMA. The upward move was quite strong and even broke through $170 resistance level. Ethereum went up to $182 to test the resistance between $180 and $185 before correcting downwards. However, the support around $155 stopped further losses.
Ethereum soon recovered upwards and moved over $165 resistance level. However, currently, ETH is facing a lot of selling pressure around $170 which could push the price back downwards. It Ethereum moves below $155 support level, it could turn bearish and fall towards $140 range, however, if the buyers remain in action and move the price above $180, it could result in ETH testing $200 range. There is a bullish pattern formed on the hourly chart with support around $153. Also, a breakout triangle is placed with resistance around $170.
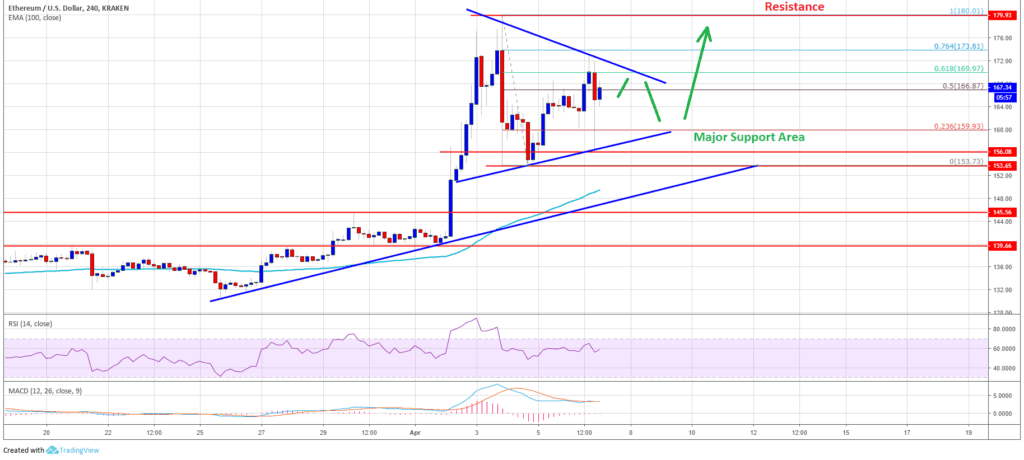
The chart shows that Ethereum is currently bullish and well placed over $150 support level. However, if the price falls below $155, it could become bearish and fall back to $140 range.


