

Technical Indicators:
Support Level: $157
Resistance Level: $163
Key Points:
- Ethereum price started a downward correction, however, the support around $157 proved strong enough to stop further losses.
- Strong resistance is formed around $163.
- A bearish pattern is being formed with resistance around $163 on the hourly chart.
- It is very essential for Ethereum price to maintain its position above $157 support level to avoid a bear attack.
Ethereum Price Analysis
Summary: Ethereum price is currently facing a lot of bearish pressure against both BTC and USD. If $157 support level remains strong, ETH might be able to break through $163 resistance level.
Ethereum price showed bullish moves recently after rising above $165 resistance level. ETH tested the $170 resistance zone, however, it could not break through and hence corrected downwards. The selling pressure increased and Ethereum price fell below $163 support level. ETH also fell below $160 level and the 100 hourly SMA to move into a negative zone. However, the support around $157 proved strong enough to stop further losses.
Ethereum price started to gain momentum again, however, it is facing a lot of selling pressure around $163 which is acting as a very strong resistance level. Currently, ETH is correcting downwards towards $157 support level. It is very essential for ETH price to stay above this range to avoid sharp declines.
If Ethereum price falls below $157 and $155 support level, it could test $150 and even $145 levels. However, if ETH is able to break through the $163 resistance zone, it could turn bullish and move towards $165 and $170 levels. A bearish pattern is also being formed with resistance around $163 on the hourly chart.
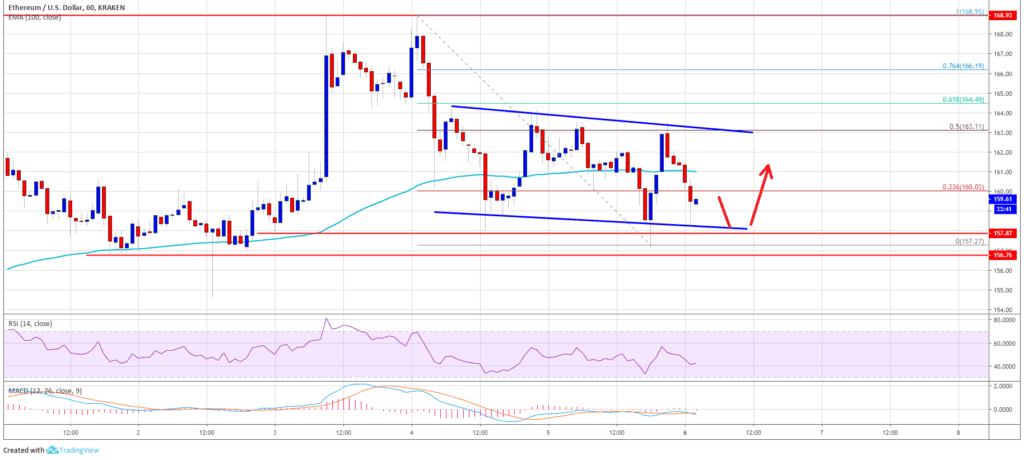
The chart shows that ETH price is currently trading in a short range over the $157 support level. If buyers stay in force, Ethereum might soon break above $163 and $165 resistance levels to move towards $170. However, if ETH breaks below $157 and $155 support level, there are chances of ETH crashing below $150 level.


