

Technical Indicators:
Support Level: $133
Resistance Levels: $136, $138
Key Points:
- ETH price is currently well situated above the $133 support level.
- Ethereum corrected downwards recently, however, $133 support proved strong enough to stop further losses.
- A bearish pattern is being formed with resistance around $136 on the hourly chart.
- ETH price will most likely break through the $138 resistance or fall below $133 support level very soon.
- ETH Price is currently getting stronger in order to break the $136 resistance. If the buying pressure keeps on increasing, Ethereum might soon break through the current resistance and move to $145.
ETH Price Analysis:
Ethereum price corrected downwards recently, however it bounced back from $130 support. Ethereum moved above the $134 level however, could not break the resistance between $136 and $138 as the selling pressure was quite high at this point. This led to ETH price correcting downwards again. The price broke below the 100 hourly SMA and $135 support level.
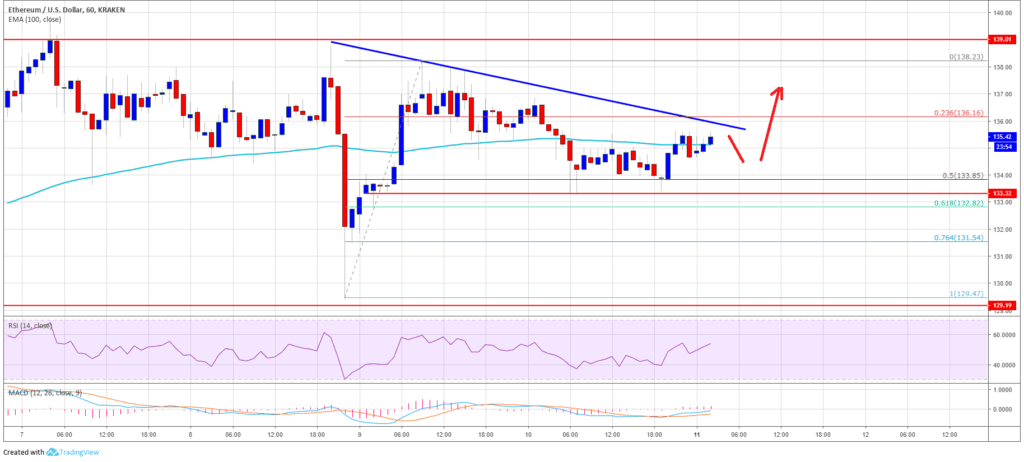
The support around $133 was strong enough to avoid further losses. Currently, Ethereum is trading in a bullish momentum, well above $135 and the 100 hourly SMA. The current resistance lies around $136 and $138. A bearish pattern has emerged at this resistance on the hourly chart. If ETH price is able to break through this resistance, then the price will move above $140 in the short term. However, if the $133 support is broken, Ethereum might move below $130.
The chart shows that Ethereum is trading in s close range and the next big move shall be very close. ETH price will either move above the current resistance or below the current support.


