

Technical Indicators:
Support Level: $132
Resistance Level: $140
Key Points:
- ETH price was not able to break through the $140 resistance level and corrected downwards.
- The downward correction even broke the $134 support level.
- A bearish pattern line is formed with resistance around $140 on the hourly chart.
ETH Price Analysis:
Summary: ETH was fell down massively against both bitcoin and USD. Ethereum even broke the $134 support level and moved into a bearish zone. The price is currently trading below 100 hourly SMA which signals a bearish trend.
Ethereum attempted to break the $140 resistance again however, it failed and crashed downwards sharply. The selling pressure kept increasing and moved the price even below the $136 and the 100 hourly SMA. Also, ETH price broke through the bullish pattern line that was formed yesterday on the hourly chart.
The downward correction was strong enough to break the $134 support. The price tested the $132 support level before starting to correct upwards. The price is trying to move upwards, currently trading around $134. However, there are a lot of sellers placed on the upside between $136 and $140 which might prove bearish for ETH price. There is also a bearish pattern line formed with resistance around $140 on the hourly chart.
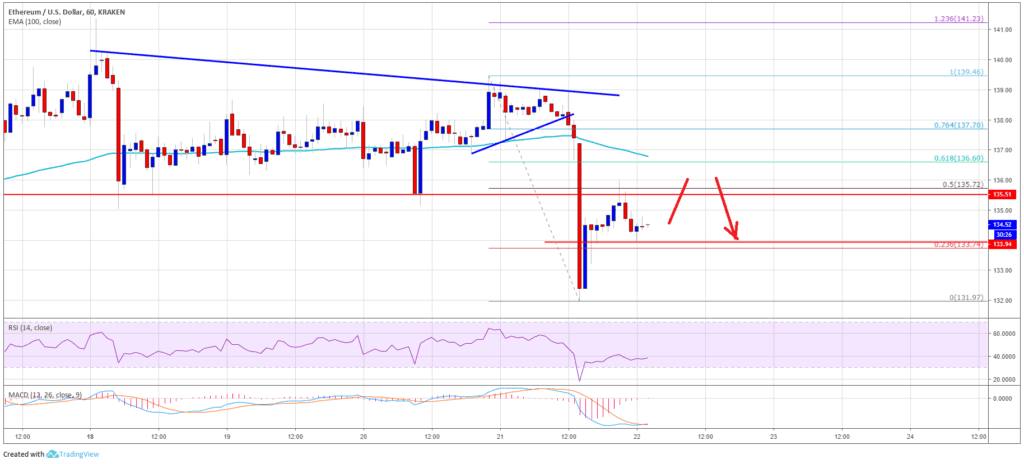
The chart shows that ETH price is now in a bearish momentum trading below $136 and 100 hourly SMA. The buyers need to gain strength in order to move the price above the solid resistance formed between $136 and $140 in order to stop further losses. Ethereum is currently supported at $132 level.


